If you are struggling with understanding your ecommerce store’s performance, chances are that you are tracking too many or irrelevant metrics.
An important part of ecommerce reporting is selecting the right metrics to inform better decisions and drive business growth.
In this article, we will walk you through the most important ecommerce for understanding and analyzing your store’s health. We will also help you set up a meaningful analytics dashboard. Let’s start!
Total Revenue
Total revenue is the total amount earned from sales of your online store before deducting any expenses. It is one of the most important metrics because it provides a snapshot of your e-commerce business’s overall financial health.
You can calculate your total revenue in two ways by adding up all the sales income you have generated during a specific time frame.
Average Order Value (AOV)
The average order value is the sum of all orders placed in your store over a defined period. This metric shows the average amount a user is expected to spend on your website per transaction.
AOV is calculated by dividing the total sales value of all purchases by the number of completed purchases.
Average order value (AOV) = The total sales value of all purchases / The total number of completed purchases
You estimate your store's average profitability using AOV, given the average cost per purchase. Upselling services or accessories, or recommending associated products, will help you increase your AOV (and profit margin).
You can also calculate the AOV by category if you can track purchases by category to get a more granular view of your e-commerce store’s profitability.
Gross Merchandise Value (GMV)
Gross Merchandise Value (GMV) is the total dollar value of products that your store sold before any deductions like discounts, operating costs, or returns.
Multiply the number of products sold by their selling prices to calculate the GMV, then add these figures across all products:
Gross Merchandise Value (GMV) = The total number of products sold × Selling price of each product
For example, if you sold 50 t-shirts at $50 each and 100 hoodies at $30 each, your GMV would be:
GMV = (50 × $50) + (100 × $30) = $250 + $3000 = $3,250
Sales Velocity
Sales velocity measures how quickly prospects convert to customers, move through the sales pipeline, and generate revenue.
To calculate sales velocity, you need four factors:
- Number of sales opportunities
- Average deal value
- Win rate
- Length of the sales cycle
Sales Velocity = (Number of sales opportunities X Average deal value X Win rate) / Length of the sales cycle
Multiply the number of sales opportunities, average deal value, and the win rate. Then divide the result by the length of the sales cycle to determine sales velocity.
In other words, sales velocity also indicates the overall productivity of your sales team.
New vs. Repeat Customer Ratio
The New vs. Repeat Customer Ratio (or New & Returning Visitor Ratio) measures your business's balance between acquiring new customers and keeping existing ones. You can measure the ratio by simply dividing the total number of new customers by the number of repeat customers. This metric is important for measuring campaign performance and understanding customer retention and loyalty.
New vs. Repeat Customer Ratio = Number of New Customers / Number of Repeat Customers
Customer lifetime value (CLV)
CLV measures the total revenue your store earns from an average customer over their lifetime. It’s an excellent metric for forecasting future revenue and guiding your customer acquisition and retention strategy.
To calculate CLV, multiply your average order value (AOV) by the average customer purchase frequency over a set period (e.g., a single quarter). Then multiply the result by the total number of periods by which your store retains an average customer.
Customer lifetime value (CLV) = (Average order value for a particular period x Average customer purchase frequency for that period ) x The total number of time periods for which an average customer is retained
Churn Rate
The churn rate measures the total number of customers or users your store loses. It helps measure long-term engagement and retention for your e-commerce businesses (especially subscription-based businesses).
Divide the total number of your customers lost by the total number of customers at the start of the period to calculate the churn rate for a set period, and multiply by 100.
The churn rate for a period = (The total number of customers lost during the period / the total number of customers at the start of the period) x 100
Measuring the churn rate regularly helps you stay on top of customer retention and quickly identify and narrow down issues that cause customers to leave your business. It also shows how many new customers you need to acquire each period to offset customer attrition.
Customer acquisition cost (CAC)
Customer acquisition cost (CAC) is the cost of acquiring a customer. It measures the cost of prompting a user to take action, such as registering as a customer, completing a purchase, or subscribing to a newsletter.
To calculate the CPA, divide the total cost of the marketing effort or campaign by the number of customers acquired in the campaign.
Customer acquisition cost (CAC) = Total cost of the marketing campaign / The total number of customers acquired through that marketing campaign
Knowing your CAC will help you optimize your marketing campaign costs by identifying the most and least practical marketing efforts. You can also compare CAC to CLV (customer lifetime value) to assess the profitability of your marketing efforts. For instance, if your CLV is lower than your CAC, your marketing campaign is running at a loss. It may not be sustainable over the long term.
Take into account your labor costs (salaries), agency fees, marketing software subscriptions, ad spend, and pay-per-click advertising to calculate total marketing campaign costs.
Stock Levels
Stock level is the quantity of goods available in inventory at a given point in time.
The right stock level is the most important factor in inventory management because it strikes a balance between supply and demand. Maintaining the correct stock levels helps to avoid issues like overstocking and understocking.
Sell-Through Rate
Understanding how quickly your products move from inventory to customer hands is important for any e-commerce merchant or retail operator. Sell-through rate (STR) measures the percentage of inventory sold within a given period relative to the inventory received or available for sale. It’s a direct indicator of inventory efficiency and product demand.
Sell-Through Rate (STR) = (Units Sold / Units Received or Available) X 100
Let’s assume you received 100 units of a new t-shirt and you sold 50 of those t-shirts over the next 30 days. So, your sell-through rate for that period (of 30 days) is 50% (50 units sold / 100 units received).
Sell-through rate is a continuous metric that tracks performance over a defined period and provides ongoing insights into inventory health and sales velocity.
Reorder Points
A reorder point is the level of inventory at which a replenishment order is set off so as to avoid running out of stock. In ecommerce operations, it defines the point at which inventory transitions from “sufficient” to “action required.”
The reorder point is not about how much to order, but about when to order. It acts as a signal that remaining inventory must cover expected demand during the supplier lead time, plus any buffer needed to absorb uncertainty.
Operationally, the reorder point protects continuity. If replenishment is triggered too late, inventory reaches zero before new stock arrives. If it is triggered too early, excess inventory accumulates and ties up cash.
For ecommerce brands, the reorder point is one of the most important control mechanisms linking demand, lead times, and inventory risk.
Inventory Turnover
Inventory turnover measures how quickly you sell through your inventory over a specific period.
A high inventory turnover rate indicates that you are selling your goods fairly quickly. On the contrary, a low turnover rate indicates either slow sales or overstock.
The inventory turnover ratio is calculated by dividing your cost of goods sold (COGS) by your average inventory.
Inventory Turnover Ratio = Cost Of Goods Sold (COGS) / Average Inventory
To calculate average inventory, you can use this formula:
Average Inventory = (Inventory at the Beginning of the time period + Inventory at the End of the time period) / 2.
Fulfillment Time
Fulfillment time is the time from when a customer places an order to when they receive it.
Fulfillment time = Source Time + Production Time + Delivery Time
The order fulfillment life cycle includes several steps, from when you receive a customer order to delivery. These steps are
- A customer places an order
- Your store receives the order
- You place a manufacturing order
- Your team starts the manufacturing process
- The order is finished and packed
- The order is delivered to the customer
This fulfillment cycle takes days or even weeks to complete. Sometimes, it may be affected by factors outside your control, such as international shipping. But it is best to keep your average fulfillment cycle as low as possible (usually a few days).
Return Rate
The return rate is the percentage of customers who returned your products. Divide the total number of returns your store accepted in a set period by the total number of products sold in that period and multiply by 100 to calculate your return rate.
Return rate for a period = (The total number of products returned in a period / The total number of goods sold in the period) X 100
A high return rate indicates issues with your store’s product quality or a mismatch between customer expectations and product quality. Having a clear, transparent returns policy in place is important for retaining buyers.
Customer Service Tickets
A customer support ticket is a record that is created for every issue a customer raises. The ticket includes complete details of the customer's request, such as the nature of the issue, its current status, and priority level, in a centralized system easily accessible to the support team. This way, every interaction with your customer is tracked from a single dashboard.
This approach ensures your team won’t lose track of requests and reassures customers that their issues are being actively managed.
How to Measure These Ecommerce Metrics?
Shopify's native analytics let you analyze your store's performance from a unified dashboard. To access Shopify's native analytics dashboard, log in to your Shopify store and select Analytics from the left navigation menu.
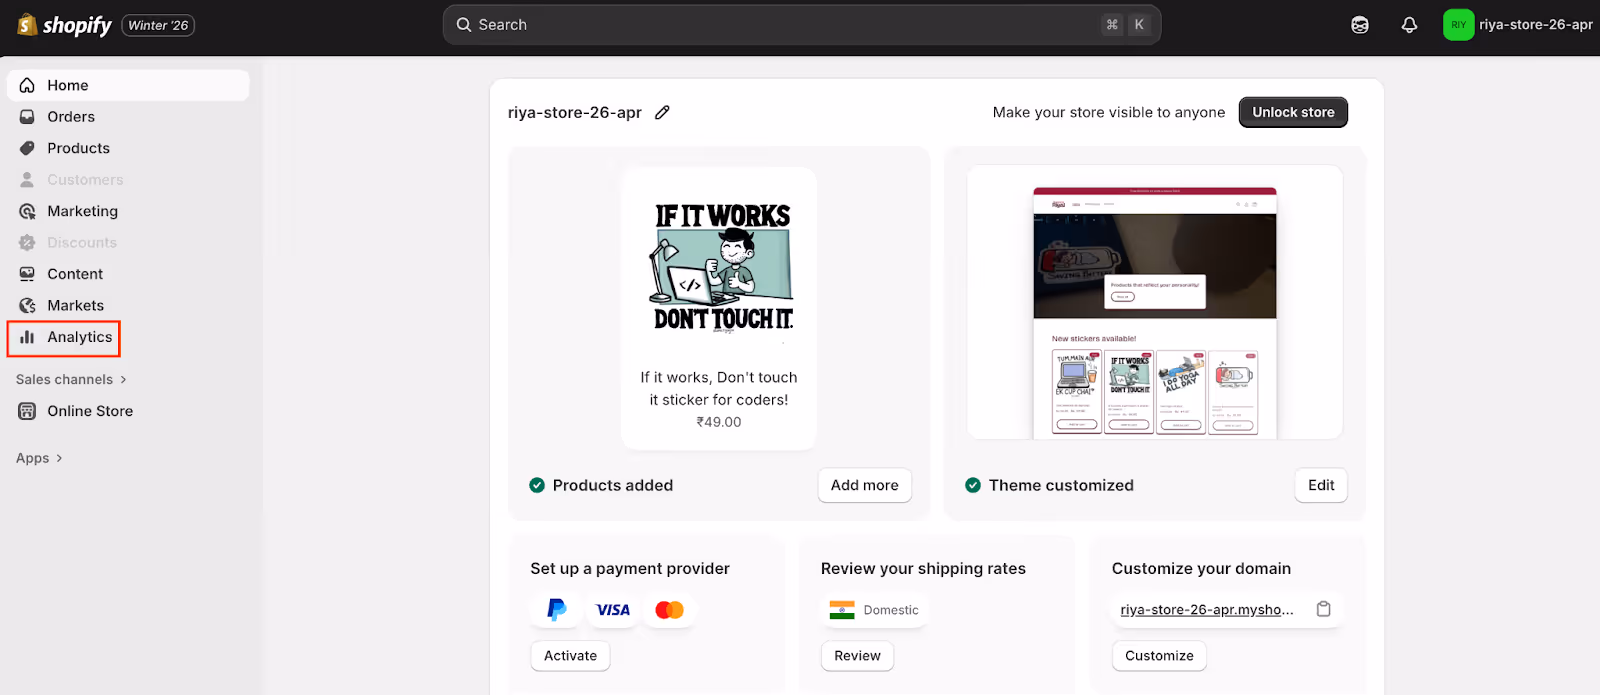
The Analytics dashboard displays metrics including gross sales, returning customer rate, orders fulfilled, total sales over time, average order value, conversion rate, and more.
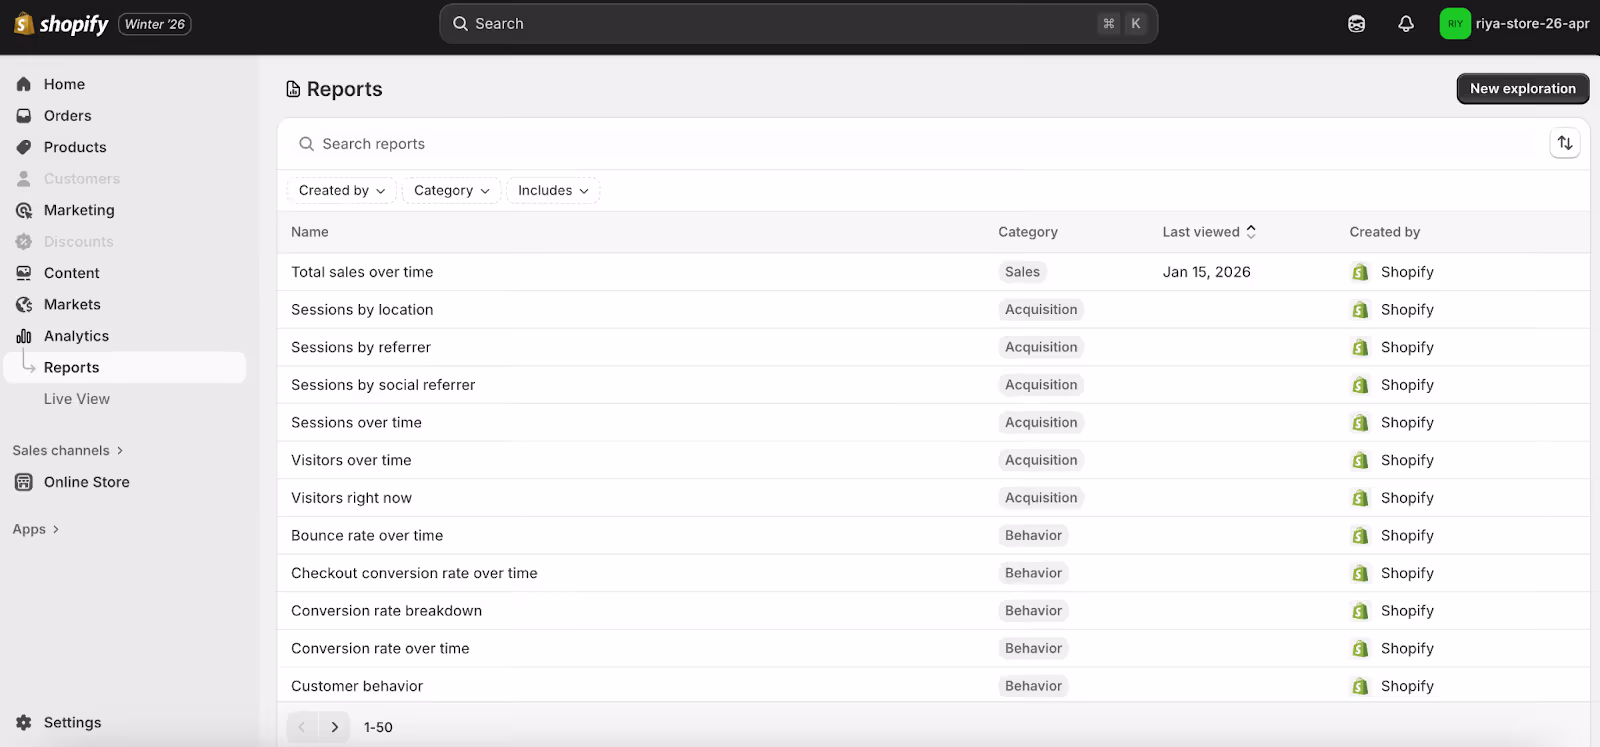
The Shopify reports (accessed from Analytics > Reports) provide deeper, richer data on specific metrics or sets of metrics.
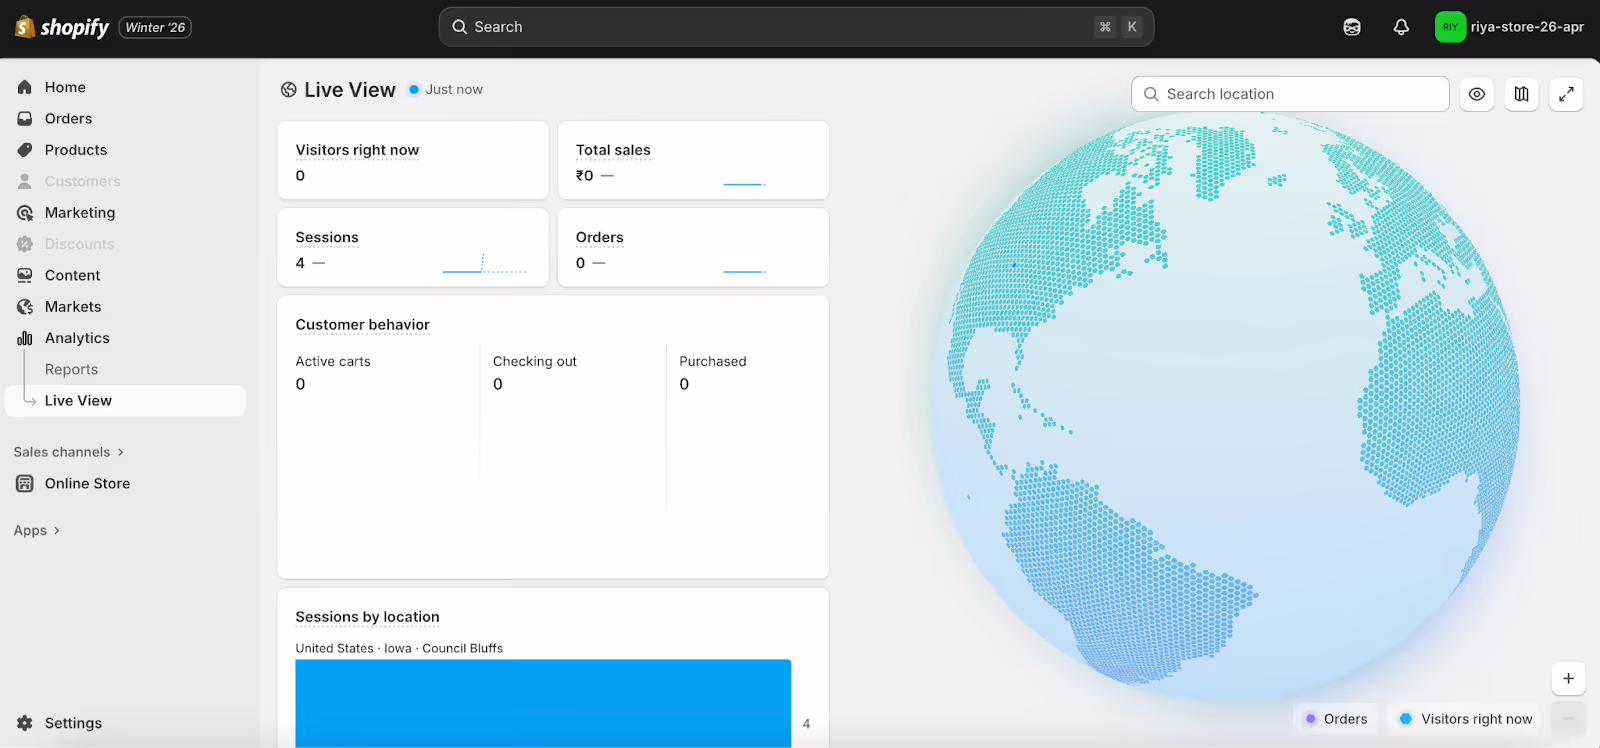
The Live View provides a real-time view of your store’s activity.
If data on your store's performance is not available in Shopify Analytics, you can use Google Analytics. Google Analytics lets you track visitors, sessions, and other customer behavior on your store.
Before you can start collecting data on your store, you need a Google Analytics account and a Google Analytics 4 property.
The easiest way to set up Google Analytics 4 for a Shopify store is to use the Google & YouTube Channel App, which requires no technical expertise to implement. You can learn about it in our help article.
Your turn
Selecting the right ecommerce metrics to understand your store’s health means focusing on the ones that drive real growth instead of tracking every number. Frame a narrative around your store’s data so that everyone in your team understands what’s happening.
Use analytics tools that help you relate one metric to the other, and visualize and share insights. This approach will help you to adapt quickly to market changes and boost your ecommerce store’s revenue.