Introduction
For your Shopify store, to make and maintain efficient sales across various channels, you need to first understand the complete customer journey. You need to know if a customer is finding you on social media, returning to your website via an email, and then purchasing after a push notification. And you cannot measure this with separate reports that may be disconnected, so that's why omnichannel tracking connects these interactions into a single, clear view. This allows you to see which channels truly get revenue, optimize your budget, and improve customer experience. In this blog post, we will explore the best types of tools to build this unified view and use data to make decisions for your business.
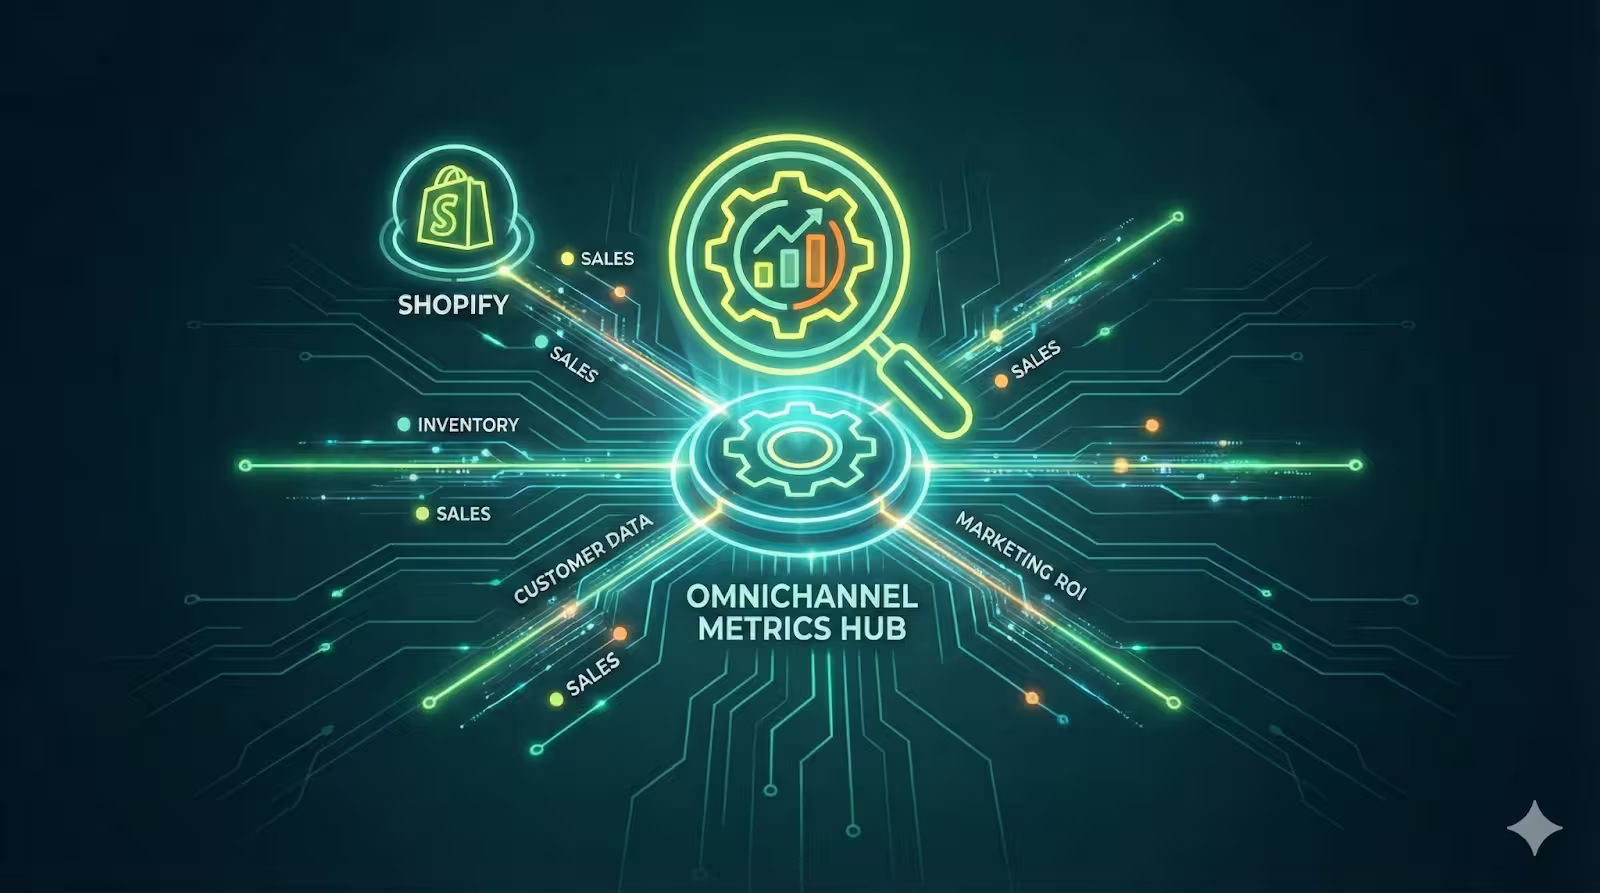
Understanding The Three Pillars of an Omnichannel Tracking Stack
To efficiently and properly monitor and track your customers journey to your store, you can't depend on just one tool. A full omnichannel tracking system needs three types of platforms to work together.
- Pillar 1- The Foundation- All-in-One Platforms: First, you need an all-in-one analytics platform, which provides you with a wide, overall perspective on your performance across all marketing channels and devices.
- Pillar 2- The Connective Layer of Data Connectors: Second, you need some specific and specialized data connectors. These tools transfer and consolidate data from your different platforms into one central place for reporting.
- Pillar 3- The Channel-Specific Tools: And lastly, you need execution and attribution hubs, which are the useful marketing tools you use to launch your campaigns, and they give you all the detailed, channel-specific revenue attribution.
This three-pillar method gives you a broad view of the journey while providing specific data on each channel's return on investment. We will explore these three pillars in detail and how to use them to expand and develop your business.
Pillar 1: All-in-One Platforms for a Bird’s Eye View On The Metrics
For Shopify store owners, using Shopify Analytics provides an easy and trustworthy source of valid, accurate information. This collection has ready-made reports that pull out the right and required data directly from your store’s backend and provide the necessary metrics on sales, customer behavior, and marketing performance without any setup.
Google Analytics 4 (GA4): The Gold Standard Across All Your Devices
For Shopify stores, this is a highly reliable, powerful, and efficient platform that is mainly built for modern, varied customer journeys. One of its most valuable features is cross-device tracking, which links user actions from smartphones, tablets, and desktops into one cohesive journey. Since Google Analytics 4 operates on an event-based model, here every click, page view, or purchase is logged as a dynamic and separate event. This helps give you a detailed analysis of how users move from discovery channels to your store.
Who is it best for: This analytics tool is best for marketers who want to understand the complete top-of-funnel process and the relationship between paid advertising and organic traffic.
Understanding its limitations: Though GA4 is great for overall journey mapping, it does not specifically link revenue to certain owned marketing channels, such as email or push notifications. Its complexity can also be challenging for newcomers.
Shopify Analytics: Your Built-in Ecommerce Control Hub
For a more reliable and direct source of your analytics data and information, using Shopify analytics can provide you with a collection of ready-made reports that pull data directly from your store’s backend. This allows you to access the right metrics on sales, customer behavior, and marketing effectiveness without any setup. It acts as your main ecommerce center, keeping all the essential information in one place.
Who is it best for: This is very helpful for store owners and merchants who need quick, easy, and integrated insights to check daily performance and important business health metrics.
Understanding its limitations: It mainly concentrates on activities happening directly in your Shopify store, offering limited insight into the detailed performance of external marketing channels, such as social media ads or email campaigns, before a user visits your site. This information can be useful for you in reviewing your overall customer journey.
Pillar 2: Data Connectors to Build Your Single Source of Information
Though the all-in-one platforms provide you with the data, it usually stays separate, and the second pillar addresses this issue. The data connectors are important tools that transfer information among your various tools, forming a single collective report.
Supermetrics: The Data Channel for Marketers
It mainly focuses on gathering and combining data and serves as a pipeline for automatically gathering raw performance data from more than 100 marketing, analytics, and ecommerce platforms. You can connect many different sources, including Meta Ads, Google Analytics, and Shopify, and then transfer that data to well-known tools like Google Sheets, Looker Studio, or any other business intelligence software. This automation greatly reduces the time spent on manual reporting.
Its main purpose is to create a single source of relevant, accurate, and valid data for your reporting dashboards. With all your channel metrics combined in one area, you can easily compare performance, assess the true return on ad spend/ROAS, and produce executive summaries. This is most suitable for teams that can work easily with spreadsheets and need to create custom, combined reports that tools like GA4 or Shopify Analytics cannot generate alone.
Segment: The Enterprise-Level Customer Data Platform
This operates at a more basic level compared to a reporting tool, and is a Customer Data Platform that manages the flow of user-level information. Instead of simply just pulling final metrics, this CDP collects in-depth behavioral data from all of the customer interactions on your website, mobile app, and server.
Using the segment creates a reliable and accurate foundation for personalization and analytics throughout your entire stack. For example, a customer’s browsing history collected by Segment can be sent to both your email tool for segmentation and your analytics platform for journey analysis. It is most suitable for larger businesses with complex tech stacks that require a strong, centralized system to manage customer data flow and ensure every tool has the right information.
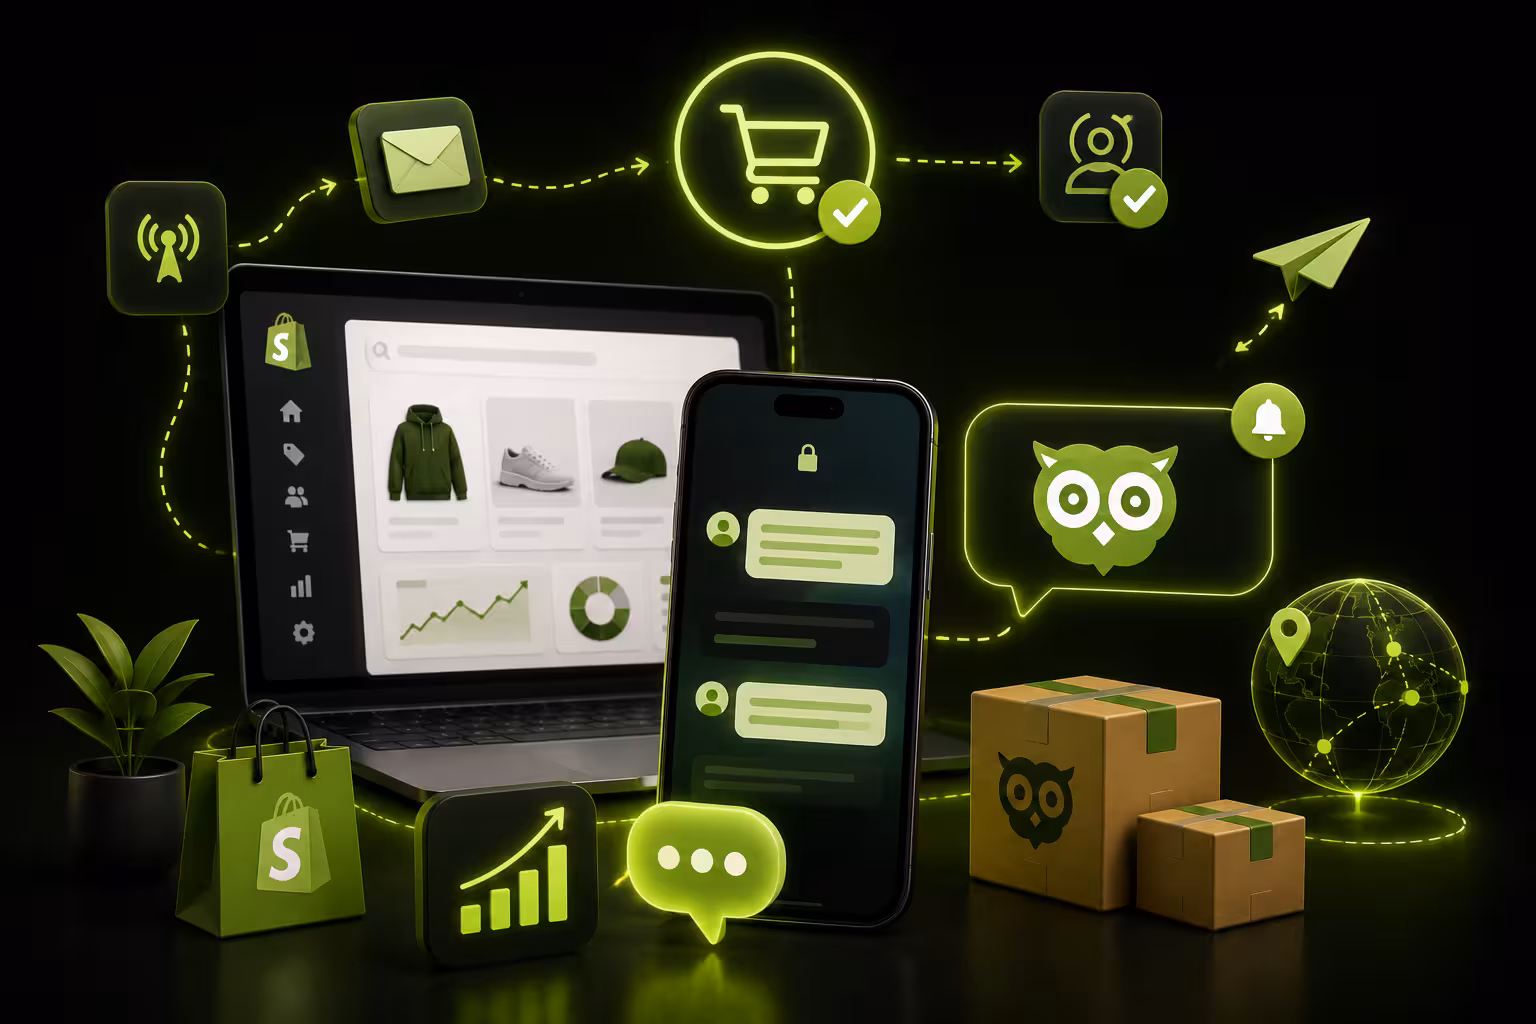
Pillar 3: The Shopify Ecosystem – Understanding Execution & Direct Attribution
The third pillar shows the tools you engage with daily to connect with customers. They have embedded analytics that are very important because they give you the direct revenue results of your marketing strategies.
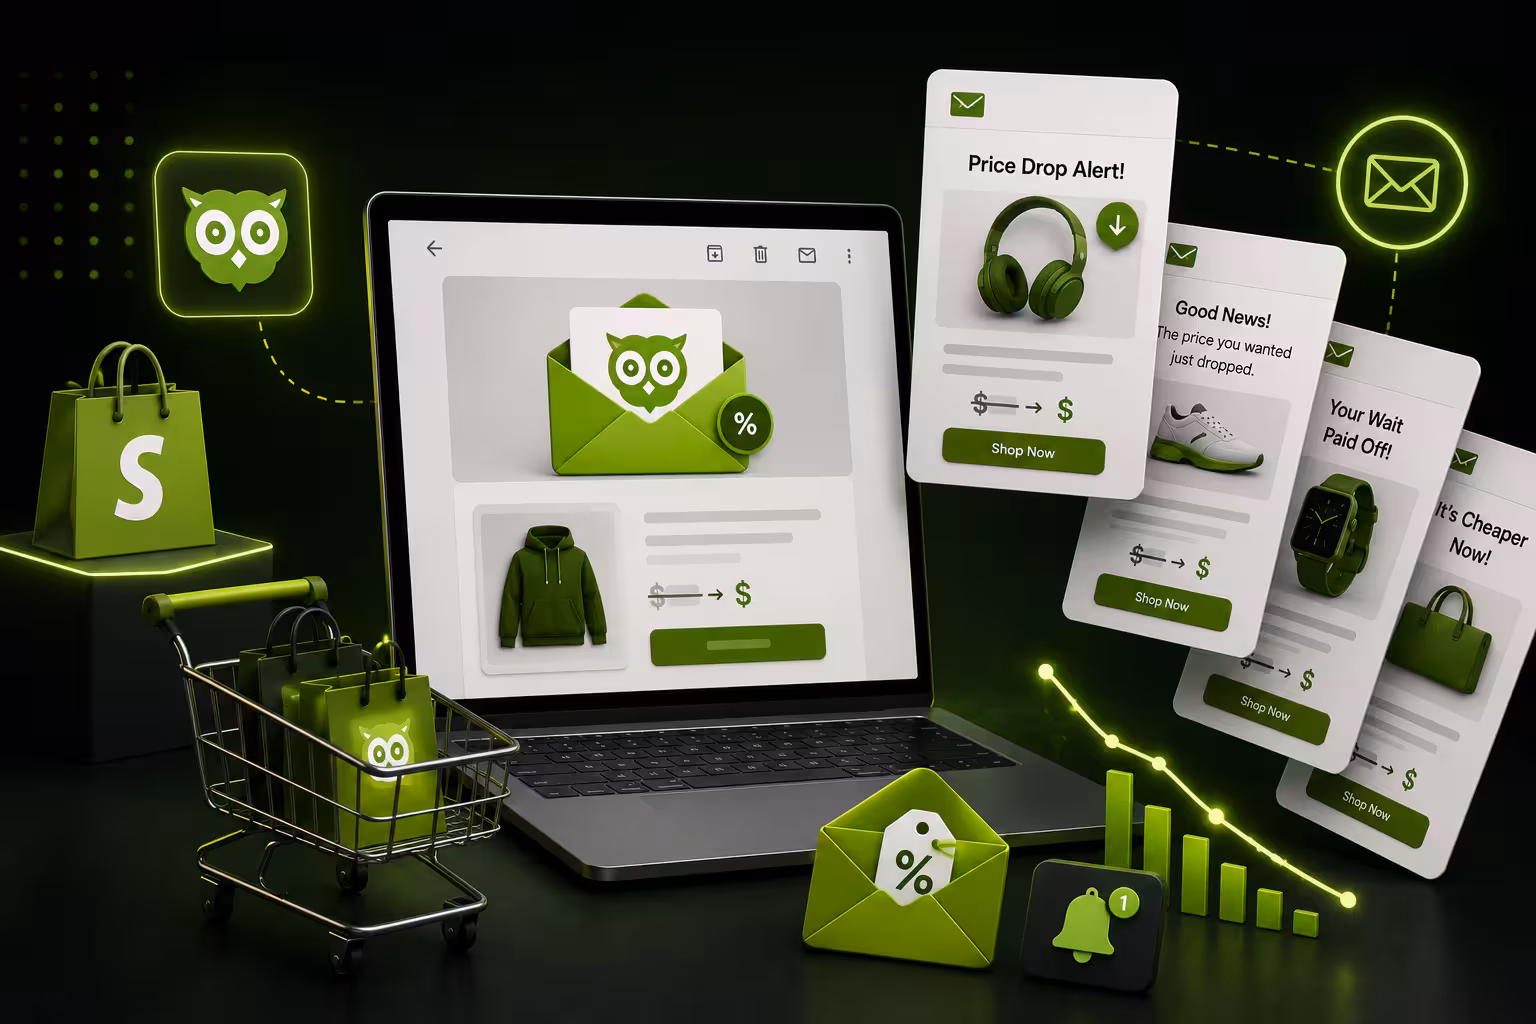
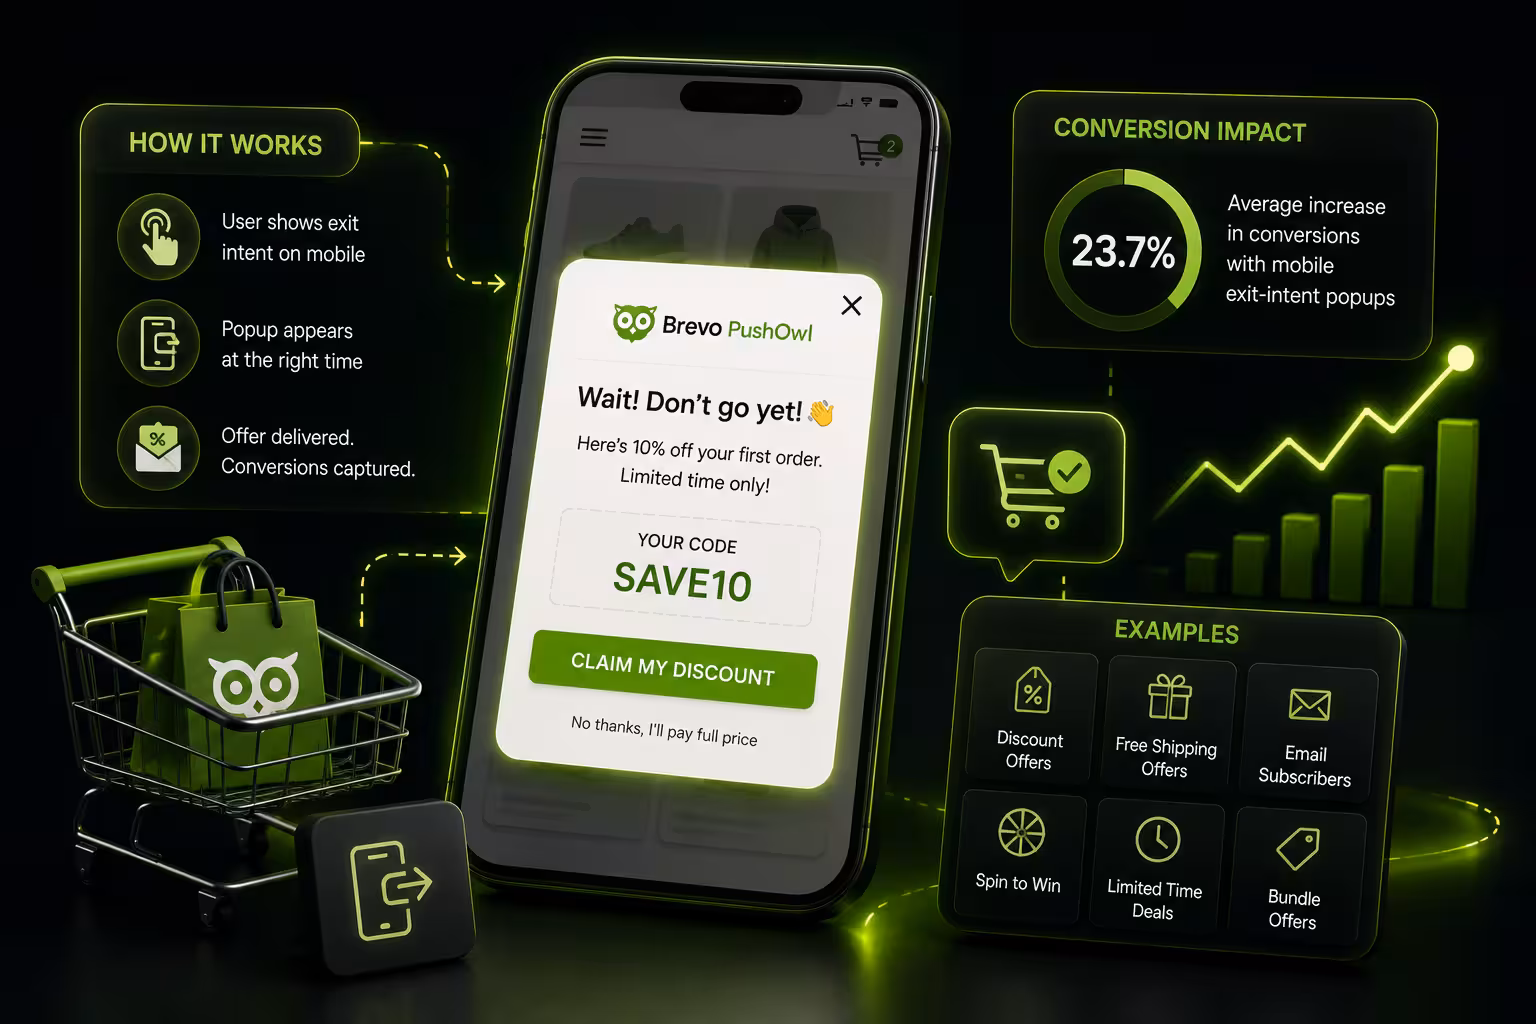
PushOwl: Mastering Push Notification, Email, and SMS Attribution
This tool is not only for broadcasting, and sending the traditional web push notifications, emails, and SMS, like many other platforms today, but it also acts as an attribution engine for your owned marketing channels. PushOwl is built to track the sales these messages produce, since it connects customer clicks to purchases in your Shopify store, giving you clear revenue data at the campaign level.
PushOwl provides you with an omnichannel advantage for your store, along with a connected view of your direct channels. For example, it can show you if a customer clicked a push notification, then later made a purchase after receiving a follow-up email. This insight helps you understand how your channels work together to guide a customer to a sale, more than just the traditional siloed reporting, to see the correct effect of each channel.
Key Metrics You Can Track in PushOwl:
In the dashboard, you can check all the necessary and important performance indicators. This includes direct revenue attribution for each campaign, showing exactly how much money a certain push notification or email series has earned. You can easily figure out the return on investment for your push, email, and SMS initiatives. Additionally, you can check your subscriber engagement and lifecycle metrics to understand your right audience health and optimize the sending times accordingly.
Klaviyo: The Email & SMS Automation Powerhouse
When it comes to automating email and SMS marketing, Klaviyo is one of the top platform choices. Its success comes from its smooth integration with ecommerce platforms like Shopify, enabling precise revenue tracking. You can easily see which automated flow or campaign resulted in a sale and the total revenue it generated.
The platform provides you with strong analytics information that focus on customer segmentation, showing how various groups react to your messages. It also includes predictive analytics, which estimates potential customer lifetime value and shows those who are most likely to buy. This makes Klaviyo ideal for businesses that depend on email and SMS for revenue, as its comprehensive features are tailored to enhance the effectiveness and measurable returns of your marketing strategies.
How to Use PushOwl for Tracking Omnichannel Ecommerce Metrics
You can use PushOwl to check the important omnichannel metrics by using its built-in analytics for your owned channels. Start by checking the main Dashboard, which gives an overview of the revenue generated from your push, email, and SMS campaigns, and this is your initial step in directly attributing revenue.
Next, you need to check and analyze each individual campaign reports. For each broadcast or automation, you can see detailed metrics like sends, clicks, and most importantly, giving sales and revenue. Then you can easily compare the performance of different message types, such as a web push versus an SMS, to understand which channels give you the highest return. You can also choose to divide this data by customer groups or different time periods to identify the various trends.
In the end, use PushOwl’s data to guide and make your strategy on a wider scale for your store. The revenue from a push campaign should be included in your overall channel ROI assessments. By consistently tracking this, you can easily get a clear view of how your direct marketing channels affect your total store performance, getting you closer to a real omnichannel outlook for your Shopify store in one place.
Building Your 7-Tool Omnichannel Dashboard
Here is a value add that you can use for your Shopify store, a complete omnichannel dashboard that combines tools from all three pillars. Let us see a practical example of how they can work together.
How This Stack Works Together
Here, each tool has its own function, and data flows between them to build a complete view. For example, PushOwl connects a sale to a specific push notification campaign. That sale is recorded as revenue in your Shopify Analytics. Then, a tool like Supermetrics can extract the sales data from Shopify and the related campaign cost data from PushOwl into a single Google Sheets or Looker Studio report.
In this report, you can finally see the overall combined metrics, such as the real customer acquisition cost or return on ad spend for your owned marketing channels, by integrating cost and revenue data that was previously separate. This approach converts the different and isolated data points into actionable business information for your entire marketing strategy.
Your Free Omnichannel Attribution Model Template
To help you start, you can use this free Google Sheets template, and this tool is designed to simplify the process of unifying your data. The template offers a single dashboard with specific areas for your main platforms. You can enter data by hand from sources such as GA4, Shopify, PushOwl, Klaviyo, and your ad accounts. Most importantly, it has straightforward guidelines on using a data connector like Supermetrics to automatically bring in this data, which saves you a lot of time.
Once your data is in the sheet, the template performs the required calculations for you. It automatically computes channel-specific metrics such as customer acquisition cost and return on ad spend for each marketing channel. This gives you a clear, single-page view of your overall marketing performance and profitability, helping you to allocate your budget wisely according to these statistics.
What you will need for the template:
Get the channel cost data from the dashboard, this can be manual or auto-populated via Supermetrics.
Next, get the revenue attribution data from Shopify, GA4, and Execution Hubs, like in the example table given below.
You can now calculate the ROAS, which is equal to the Revenue / Spend, and the CAC, which is equal to the Spend / Number of Customers Acquired via the particular channel. Remember that this unified performance dashboard will be auto-calculated.
How to use the template:
- Enter your data in a spreadsheet and fill out the Data Input Tables with monthly spending and revenue figures from each channel. For revenue, check the direct attribution data from platforms like PushOwl or Shopify Analytics.
- You can consider using a data connector like Supermetrics to connect your advertising platforms like, Google Ads, Shopify Analytics, and PushOwl/Klaviyo, directly to these sheets, and then also configure it for automatic refresh.
- The new performance dashboard will automatically calculate your key metrics, showing which channels work best. You can now use this data to guide your budget decisions.
Remember that this model's accuracy is based on the use of accurate direct attribution data from your execution hubs, like PushOwl for owned channels, along with the cost data from your ad platforms.
Closure Note
To successfully monitor all channels, you require three kinds of tools: all-in-one platforms for a complete view, data connectors to consolidate information, and execution hubs for tracking revenue directly. This approach helps you shift from uncertainty to understanding which channels truly impact your sales.
For channels you control, such as email, SMS, and push notifications, a tool like PushOwl can be very useful and efficient. It provides clear revenue attribution for these campaigns, revealing their actual impact on your store's performance. By merging these insights with your overall analytics, you can come up with a complete, data-driven view of your customer journey and improve your entire marketing strategy.