Numbers.
Percentages.
Decimals.
Your Shopify store’s performance is hidden among the above.
E-commerce metrics quantify every aspect of how you conduct business. Are you acquiring enough customers to justify your marketing budget? How many users are visiting your website but not getting to checkout? How many users are clicking on your ads?
To get a handle on all these and more, we made you a guide on e-commerce metrics to track in 2026. Dive in!
What Are E-Commerce Metrics and KPIs?
E-commerce metrics and KPISs (key performance indicators) show how successfully your business is performing. When you keep an eye out for this data, you eliminate unnecessary guesswork about the behavior of your customers.
That doesn’t mean you have to monitor every metric under the sun (or on your e-commerce metrics dashboard)
The following metrics help you check whether you are targeting customers properly, whether your products are popular, and at which stages your customers are stuck.
19 Key E-Commerce Metrics To Track
You will find hundreds of metrics across your dashboard. Cut through the noise by focusing on the following:
Metric 1: Impressions
Impressions indicate how many times your content was displayed to users. This content could be an ad, a pop-up, an email, or a link on a search engine. They don’t have to click on it for it to register as an impression. If your impressions are high, it means the content is highly visible and reaches large audiences.
Impressions = Total number of times content was displayed
When you compare your impressions to clicks, you can gauge whether what the user is viewing is compelling enough to click.
You can tweak the creative placement of pop-ups and ads or test different campaign schedules to increase impressions. Impressions do not directly translate into revenue, but they are critical for assessing campaign reach.
Metric 2: Open Rate
High open rates do not guarantee clicks or sales, but they are an indicator that your emails are being noticed.
Open rates signal whether they recognize your brand and find the subject line compelling enough to engage. They are no longer a perfect e-commerce metric due to Apple Mail Privacy Protection and other tracking limitations, but they still provide a general sense of audience interest.
A sudden drop in open rate signals list fatigue or the need for cleaner customer segmentation and better subject lines. Calculate open rates with this formula:
Open rate = (Opens / Emails delivered) X 100
Comparing open rates across campaigns can help identify your audience’s behavior patterns.
Metric 3: Click Rate
Unlike open rate, which shows curiosity, click rate indicates actual engagement with the content, showing whether subscribers are taking action.
User actions include opening links or clicking on buttons. Click rates signal to the Shopify brand the level of interest and engagement their customers have in the shopping campaigns and offers.
Tracking click rates over time will help you understand your audience better and how different content layouts can impact engagement. You can check click rates with this formula:
Click Rate = (Total clicks / Emails delivered) X 100
High click rates paired with low open rates indicate strong messaging.
High open rates with low click rates suggest that the email copy needs to be more compelling.
Metric 4: Click-Through Rate (CTR)
CTR (click-through rate) is a core metric for Shopify merchants using paid or organic campaigns because it directly links creative performance with user response.
You can measure CTR for emails, ads, or pop-ups. It shows whether your message is persuasive enough to drive action.
A high number of impressions with a low CTR usually indicates that the audience is not engaging with your messaging or the creative has failed to capture attention. CTR allows merchants to compare campaigns and identify their customers’ behavioral trends, which will further help with segmentation. Here is how to calculate CTR:
Click-through Rate = (Clicks / Impressions) X 100
What is your customer clicking on and skipping?
Is changing the timing of the email changing anything?
While CTR does not guarantee conversion or revenue, it is a clear signal of whether the campaign’s content is resonating. If your click-through rate is low, it is time to refine your segmentation and messaging. Your overall e-commerce strategy will need tweaking to ensure that the right audience responds.
Metric 5: Engagement Rate
This e-commerce metric goes beyond opens and clicks. The engagement rate provides a clear picture of how actively subscribers interact with your content and, therefore, the effectiveness of your email campaigns. Calculate your engagement rate with this formula:
Engagement Rate = (Total engagement actions / Total delivered emails) X 100
Tracking engagement rates over time helps you identify high-performing campaigns, product categories, content types, and subject lines.
Metric 6: Deliverability Rate
Your email deliverability rate is the percentage of the sent emails that reach recipients’ inboxes. It is the foundation of your other email metrics because if your emails do not get the subscriber, nothing else matters. Deliverability is influenced by sender reputation, email content, frequency, and list hygiene. Assess your deliverability rate through this formula:
Deliverability Rate = [(Emails sent - emails bounced) / Emails sent] X 100
A drop in deliverability signals spam complaints, technical issues with email communication, or invalid email addresses that need cleaning. For Shopify merchants, maintaining high deliverability ensures campaigns reach the intended audience. By monitoring this email metric, they can prevent wasted spend on email marketing.
Metric 7: Spam Complaint Rate
Spam complaint rates measure the percentage of recipients who marked your marketing emails as spam. High complaint rates hurt sender reputation and deliverability. The formula for spam complaint rates is straightforward:
Spam Complaint Rate = (Spam complaints / Emails delivered) X 100
A subscriber would mark your emails as spam if you are:
- Sending irrelevant content in your emails
- Over-emailing
- Not matching what the subscriber expects when they receive an email, which might be a sign of poor segmentation
- Overloading emojis and “salesy” keywords in your subject line and email copy
Metric 8: Unsubscribe Rate
The unsubscribe rate is the percentage of recipients who unsubscribe from your emails.
To comply with data privacy laws like GDPR, your emails must include a clear unsubscribe option. As with spam complaint rates, a rising unsubscribe rate signals over-emailing or misaligned messaging. Including a short prompt that lets users explain why they want to unsubscribe will help you refine your campaigns and gain other insights into why people leave.
Unsubscribe Rate = (Unsubscribes / Emails delivered) X 100
Tracking your marketing emails’ unsubscribe rate is vital for keeping your list engaged and profitable.
Metric 9: List Growth
List growth measures how quickly your email or SMS subscriber base grows, accounting for unsubscribes and bounces.
It depends on effective lead magnets and incentives at the beginning. If you can offer a fun checklist or free resource in exchange for your lead’s email address, they will willingly share their contact information. Calculate your list growth with:
List Growth = [(New subscribers - Unsubscribes - Hard bounces) / Total list size)] X 100
Once the subscriber is on the mailing list, it is the job of your marketing emails to keep them hooked.
Stagnant or declining lists indicate you need new email strategies to attract new subscribers or re-engage lapsed ones. An email list that you have grown and nurtured with great marketing content will be more engaged than an email list you have bought.
The latter will likely drag down your sender reputation due to emails they receive without consent.
Metric 10: Conversion Rate
Your Shopify brand’s conversion rate is the percentage of users who complete a desired action (e.g., subscribing to a newsletter, making a purchase, taking a quiz) after engaging with an email, web push notification, or SMS alert.
Conversion Rate = (Conversions / Total visitors or clicks) X 100
It ties engagement directly to business outcomes, thereby indicating the overall effectiveness of your e-commerce marketing campaigns.
Seeing a low conversion rate and a high engagement rate? Then you may have an issue with landing pages or the checkout experience. Low engagement and low conversion suggest issues with broader messaging.
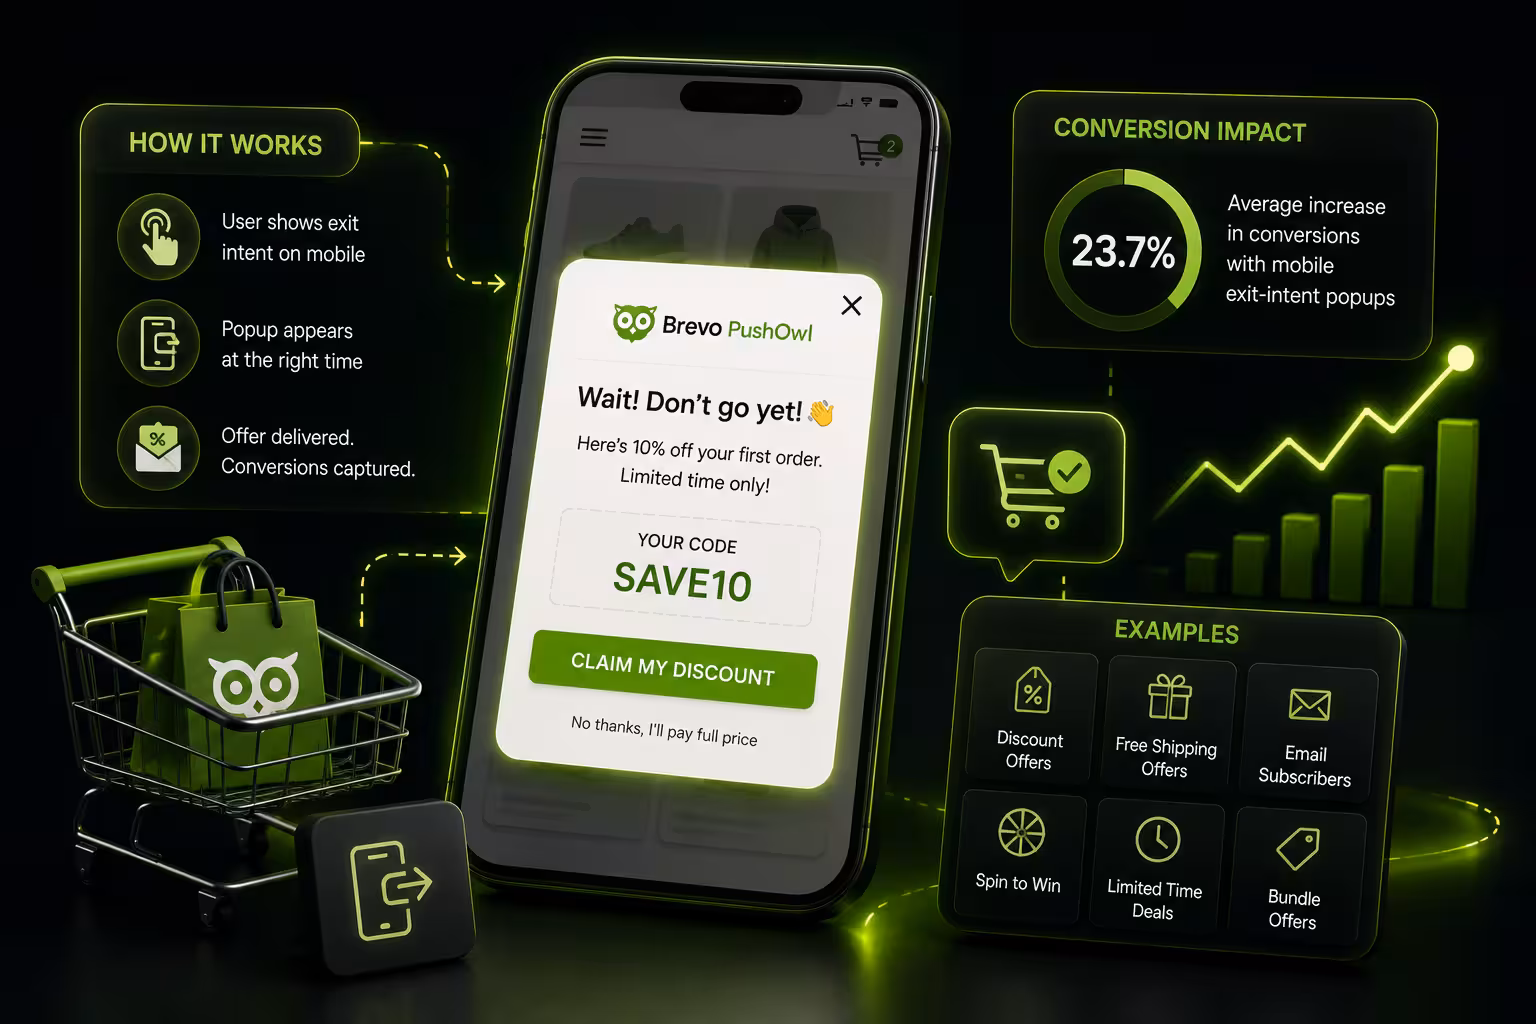
Metric 11: Shopping Cart Abandonment Rate
Cart abandonment rate is the percentage of shoppers who add items to their shopping cart but leave without completing checkout. Cart abandonment represents lost revenue opportunities. Abandoned cart recovery strategies can help bring these customers back. Sometimes a customer does not complete their purchase due to a long/slow checkout process, unexpected costs at the end, or pure distraction, among other reasons.
Cart Abandonment Rate = [(Carts created - Completed orders) / Carts created] X 100
Monitoring your cart abandonment rate will help you identify whether you need UX improvements, pricing transparency, or an omnichannel marketing strategy to recover customers via email, SMS, and push notifications.
Metric 12: Revenue Per Recipient (RPR)
Revenue per receipt measures the average revenue each email, SMS, or any other message receives.
With RPR, you can see which segments or campaigns are generating the most revenue. Unlike metrics such as open rates or click rates, it directly ties to financial performance. Revenue per recipient is beneficial when comparing campaigns with different goals or durations.
Revenue per recipient = Total revenue from campaigns / Total emails delivered
Looking at the RPR will standardize how you gauge performance and test offers/messages accordingly for each customer segment.
Metric 13: Average Order Value (AOV)
Customers will spend varying amounts of money each time they buy from you.
Average order value (AOV) means the average amount a customer spends per order across their customer lifecycle (i.e., from their first purchase with you to their most recent purchase).
Average order value = Total revenue / Number of orders
AOV helps identify trends in purchasing patterns and informs pricing strategies. It also shows the effectiveness of upsells, cross-sells, bundles, and other promotions. Shopify brands that analyze AOV by segments and product categories or campaigns are able to pinpoint (and repeat) strategies that encourage larger purchases.
Metric 14: Customer Lifetime Value (CLV)
Customer lifetime value measures the total revenue a customer is predicted to generate over the duration of their relationship with the brand. The CLV formula is:
CLV = Average order value X Purchase frequency X Average customer lifespan
High CLV indicates customer loyalty; if the brand has low CLV, it may be time to focus on customer retention (starting a loyalty program is a great way to do so!). When you track your customers’ CLV, you can also segment them into high- and low-value cohorts for targeted marketing.
Metric 15: Repeat Customer Rate
Repeat customer rate measures the percentage of customers who return for a second or subsequent purchase.
A high repeat customer rate means your customers are loyal and satisfied with their overall shopping experience. Monitoring repeat purchases helps evaluate the success of loyalty programs, customer service, email follow-ups, and post-purchase communications.
Repeat customer rate = (Number of customers with 2 or more orders / Total customers) X 100
We all know that retaining existing customers is easier than acquiring new ones, so the goal should be to grow this metric by nurturing customer trust and engagement.
Metric 16: Refund Rate
The percentage of orders returned or refunded is the refund rate. The figure reflects product quality and overall customer satisfaction.
High refund rates can signal issues with product descriptions and a mismatch with customer expectations regarding shipping and other operational processes if the product quality itself is not an issue.
Refund rate = (Number of refunds / Total orders) X 100
By analyzing the refund rates by product, segment, and campaign, merchants can proactively address issues to improve customer experience.
Metric 17: Customer Acquisition Cost (CAC)
Customer acquisition cost (CAC) measures the cost a brand incurs to acquire a new customer. The marketing budget allocated to new customers also informs pricing and product positioning.
Customer acquisition cost = Total marketing spend / Number of new customers
By understanding acquisition costs in relation to revenue, Shopify stores can ensure sustainable growth and maximize ROI across paid and organic campaigns.
You can compare CAC to CLV to evaluate profitability.
A ratio above 1:1 means that the business is making more from a customer than it spends to acquire them. A ratio below 1:1 indicates that the Shopify store is spending more to acquire customers than those customers are worth over their lifetimes.
Metric 18: Bounce Rate
A “website bounce” occurs when a user visits a website and leaves after viewing only one page without any meaningful interaction.
Bounce rate = (Single page sessions / Total sessions) X 100
If your website’s bounce rate is high, it means visitors are losing interest or are unable to navigate/load web pages. Your website may need technical optimization (layout, speed, etc.) and better content to reduce bounce rate. Your product pages and landing pages should ideally have low bounce rates (if not, customers may be facing friction on these pages).
Metric 19: Reach
Reach looks at the number of unique users who saw your content at least once. Unlike impressions, which can count the same person multiple times, reach provides insights into the breadth of your audience.
Reach = Number of unique users who viewed content
Tracking reach helps determine whether content is reaching the intended demographic and highlights gaps in targeting.
Overrated E-Commerce Sales Metrics
Your dashboard will have tons of metrics vying for your attention. But are all of them worth fretting over? We spoke to some marketing experts to identify what they feel are the metrics that should not command too much attention:
Return on Ad Spend (ROAS)
Return on ad spend measures how much revenue is generated per dollar spent on advertising. Juan Castells, a marketing expert with over 13 years of experience, warns marketers about putting too much emphasis on this metric:
“ROAS, especially as paid channels look to claim attribution without considering all the touch points a browser has before becoming a customer. This is misleading, as it doesn't consider your COGS (cost of goods).”
He suggests POAS (profit on ad spend) as a replacement metric that better indicates whether you are getting the most out of each ad dollar.
Social Media Follows
Having a million-plus followers across your social media channels seems like a great feat, but it does not always indicate real growth. Himanshu Agarwal, a marketer with 10+ years of experience with assisting numerous Shopify brands with their campaigns, finds social media follows overrated:
“Follower metrics are important during campaigns, but don't always relate to conversion rate or meaningful business outcomes. A high total follower count, for example, does not necessarily reveal what interests your customers or what they purchase.”
Nurture your social media pages and also track whether a spike in followers during specific campaigns is driving proportionate revenue.
Sales By Channel
Your Shopify dashboard will also show you which channels are bringing in sales. But in omnichannel marketing, it is not a reliable e-commerce metric and may lead you to prioritize the wrong channels.
Castells sees numerous Shopify brands in the UK prioritize sales by channel, but he cautions against faulty attribution:
“Depending on the product you sell, you normally have several touch points from awareness to conversion, and with paid channels being very eager to all claim attribution to themselves, it's very easy to obsess over particular channels when it's very likely your customer is interacting with you via multiple ones.”
The solution? Use sales by channel to tentatively allocate marketing resources, but keep in mind that customers make decisions across multiple touchpoints, not just the last channel before purchase.
Underrated E-Commerce Metrics and KPIs
In addition to the core metrics discussed earlier, here are e-commerce performance metrics that deserve extra attention but are often ignored by Shopify brands. Pay attention to:
Repeat Visitor Lag Time
Repeat visitor lag time measures the number of days between the customer's visit and the purchase.
It assesses the time it takes for a customer to convert.
“Many stores look at lifetime value only, yet lag time shows how quickly our visitors’ engagement fades. A beauty brand I counseled was able to decrease lag time from 16 days to 11 days and experienced a 22% increase in repeat sales without any additional ad spend, merely by changing the timing of the email directed to those purchasers after sale.” - Jin Grey, CEO of Jin Grey SEO Books
Well-timed email campaigns can help reduce this lag time. PushOwl lets you customize the send time for individual customers so they receive alerts during their “most likely to shop” window.
Test PushOwl’s Smart Delivery
So, for example, if you run a skincare brand and Lucy, a 17-year-old high school student, is your customer, sending her alerts during her class hours will not be fruitful.
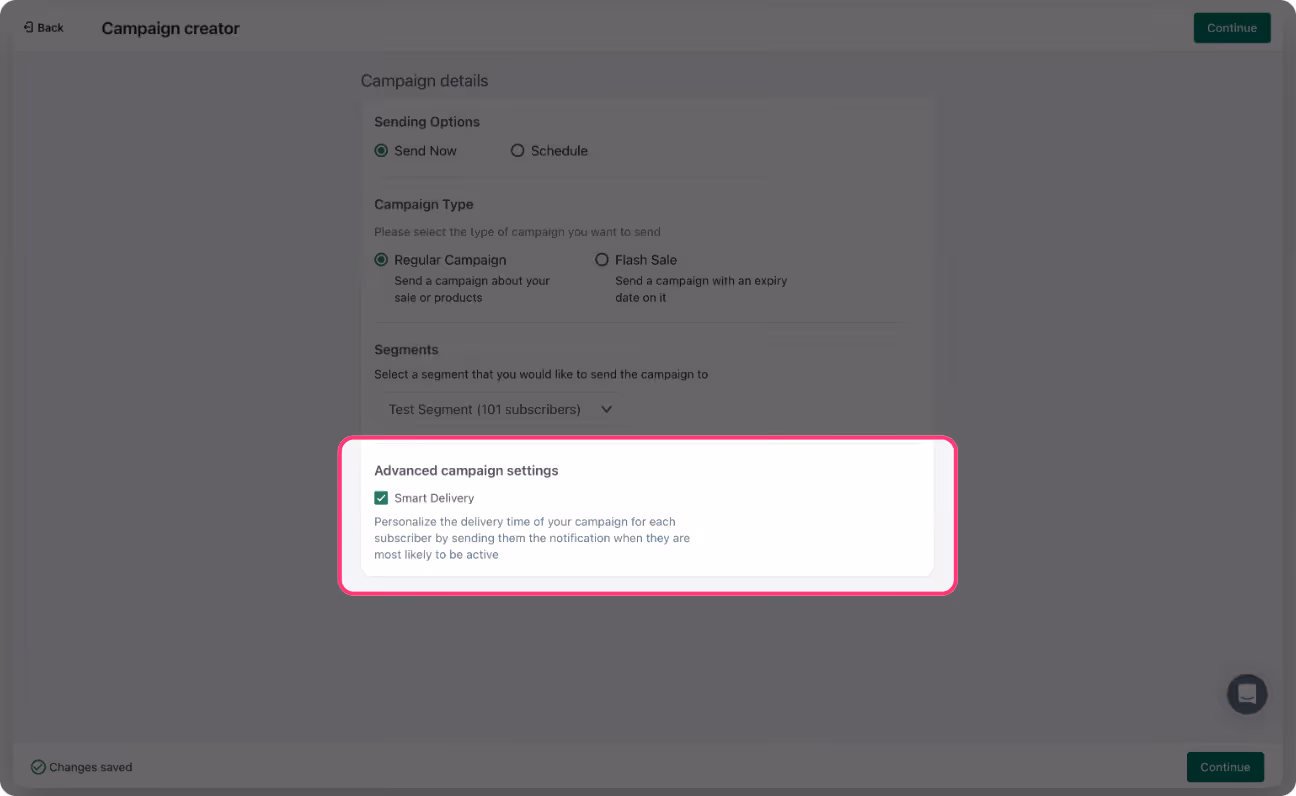
You can tailor the time you send her alerts outside school hours. For 30-year-old Stacey, a mother, sending her alerts early in the morning may be helpful.
Repeat Visitor Rate (RVR)
The repeat visitor rate is the percentage of visitors who return to your store website more than once within a given time window.
Repeat visitor rate = (Number of repeat visitors / Total visitors) X 100
If your RVR is high, it means your content strategy is working, and your website is a source of authority and trust.
Direct Search Traffic
When it comes to making your marketing content more visible on search engines, Shopify store founders look at impressions, CTR, and clicks.
But there is one more metric.
Direct search traffic refers to visits stemming from a user typing your brand name directly into the URL bar or clicking a bookmarked link.
Lou Haverty, owner of Skid Retailer, has noticed other stores ignoring this metric:
“Short-term conversions from related keywords are critical early on, but over time, you really want to see a positive trend in searches for your brand name. This brand name search trend is important to Google and is also the best indicator of long-term growth of your business.”
Direct search traffic indicates high intent and customer loyalty.
Don’t Let the Spreadsheets Win
If you are tracking every metric and drawing insights from them, you will not have time for anything else. Knowing which metrics are essential and which ones you can skip is key to not drowning in a bunch of spreadsheet tabs. PushOwl helps you track metrics for email, SMS, and push notifications, so if you would like to take those off your plate, try our free plan!