Having trouble trying to make sense of your ecommerce store? The problem might be that you are measuring too many irrelevant metrics or not measuring enough!!
Selecting the proper metrics to help you make better business decisions is an essential part of ecommerce reporting.
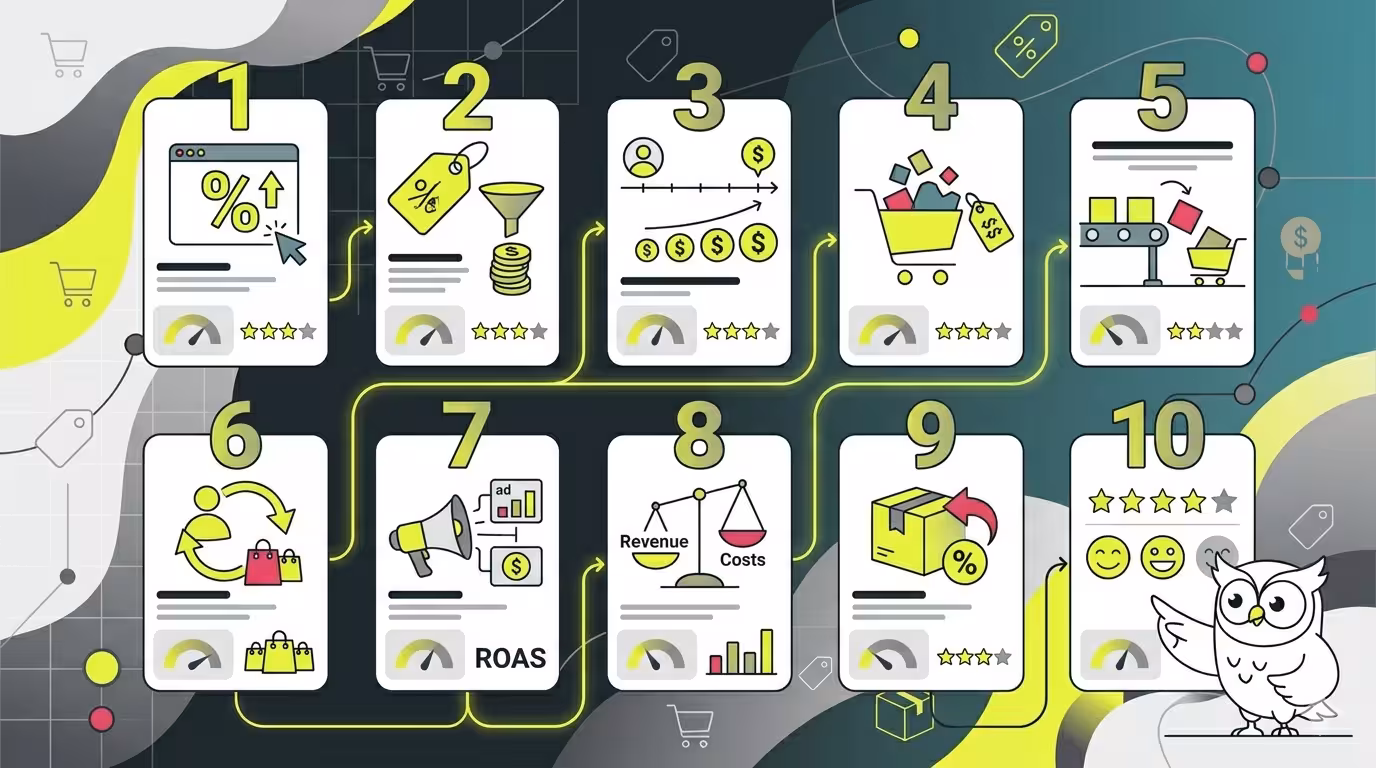
Here, we will introduce you to the most important ecommerce metrics for dashboard analysis. We will also guide you in creating a meaningful analytics dashboard. Ready?
Gross Merchandise Value (GMV)
Gross Merchandise Value (GMV) is the total value of all transactions in your store for a specific period. Why do e-commerce sites need to monitor GMV? - Since GMV is very representative of the growth of an e-commerce business, it reflects how well your business is doing. It measures the volume and amount of product sales, as well as the total transactions of your company.
If GMV is rising, your store is obviously performing well.
Gross Merchandise Value (GMV) = Sales Price of Goods x Number of Goods Sold
GMV is calculated before deducting expenses such as discounts, delivery costs, returns, and advertising costs, among other things.
Net Revenue
Net revenue is the money that your shop actually earns each month, after deducting taxes, discounts, fees, and returns from all of your sales. It shows you how well your ecommerce business is doing financially. You can increase it and make your store more profitable by:
- Optimizing your pricing strategies
- Reducing returns
- Implementing subscription models
Net Revenue = Gross Revenue - (Returns + Allowances + Discounts)
Average Order Value (AOV)
Average Order Value (AOV) describes the average value of one order that is placed on your ecommerce site.
It is found by dividing your store's total revenue by the total number of orders placed on your website. For example, if your ecommerce store brings in total sales of $5000, then divided by the total number of orders on your website of 100, you then have an average order value of $50 on your ecommerce site.
Average Order Value as a Statistic is useful for ecommerce businesses as it shows the average amount that people are spending and can help make decisions made about marketing and pricing for the future of your ecommerce business.
Average Order Value (AOV) = Total Earnings of Your Store (in $) / Total Number of Orders
Conversion rate
Conversion rate represents the percentage of visitors to your online shop who took a specific action, for example, sign up for a newsletter, make a purchase, etc. Monitoring your conversion rate will enable you to propose improvements that will give you a great advantage in selling more products.
A number of factors will affect your store conversion rate; For instance:
- Your website's design
- The precision of your product descriptions
- The efficiency of your call-to-action
The conversion rate is a valuable measurement to check the performance of your digital marketing effort. Knowing your CVR will help you make better strategic alterations in order to develop your business.
Conversion Rate = (Number of Conversions / Total Visitors) x 100
Cart Abandonment Rate (CAR)
Cart abandonment rate (CAR) indicates the average percentage of online shoppers who add items to their cart but fail to purchase. CAR stands for around 68% to 70%.
The main reasons for shopping cart abandonment are a lack of online trust towards online shops, unanticipated costs, expensive delivery rates, or issues with the checkout process.
E-Commerce companies try to decrease the levels of cart abandonment rate as it boosts customer satisfaction and higher purchases. CAR could be reduced by making a simple and customer-friendly checkout process, providing free delivery, and all the product information on the website.
Cart Abandonment Rate (CAR) = (Number of Abandoned Carts / Total Initiated Transactions) × 100
Repeat Purchase Rate (RPR)
The repeat purchase rate (RPR) is the amount of customers who make more than one purchase from your store. A high repeat purchase rate is desirable because it suggests that your customers are happy with their first purchase and are motivated to repeat purchases from your store.
Your customer's decision to make repeat purchases from your store depends on:
- They are pleased with your product/service quality.
- The shopping experience provided is appealing.
- Prices are reasonable.
Having a high RPR is essential when operating an ecommerce website because it is a good indication that customers are pleased with your product and willing to purchase from your store again.
Repeat Purchase Rate (RPR) = (Number of Repeat Customers / Total Number of Customers) x 100
Net Promoter Score (NPS)
Net Promoter Score (NPS) assesses the likelihood of a customer to recommend your product to other people. It is able to forecast future sales growth. Your customers are asked this single question: 'On a scale of 0 to 10, how likely are you to recommend our product to a friend or colleague?'
The customers are then split into:
- Promoters (9-10). Customers who rate 9 or 10 are directly referees for your product. They are completely satisfied with your products and are willing to promote them to their friends and family. They will always be your repeat customers.
- Passives (7-8). Customers who rate 7 or 8 are passives. They are happy to buy the products from you, but they will not recommend them to their friends and family.
- Detractors (0-6): Customers scoring from zero to six are known as detractors. They are unhappy and dissatisfied with your offerings. They are not only unlikely to recommend it to their friends, family, or work colleagues but are also likely to propagate negative word of mouth about your business.
Net Promoter Score (NPS) = % Promoters - % Detractors
Customer lifetime value (CLV)
Customer lifetime value (CLV) is a metric that represents the revenue a customer generates over their lifetime. CLV is calculated as total revenue per customer divided by the number of days they have been customers of your store. For example, a given person has been a customer of yours for 10 months with a monthly activity of $100. His lifetime value CLV) is $1,000.
Another application of CLV is for online businesses to decide on marketing investments and forecast future behaviors. For instance, once you know that your average CLV is $1,000, you can invest up to a tenth of your CLV in attracting a new customer profitably.
Customer lifetime value (CLV) = Total revenue of a customer (in $) / Number of days they have been your customer
Fulfillment Rate
Order fulfillment rate is the percentage of customer orders that were shipped and received in full. It is an essential ecommerce metric to measure the dependability of the order fulfillment. A high order fulfillment rate indicates that your delivery, warehouse management, and stock control processes run smoothly.
Your shipments are delivered on time with no excuses or backlogs, etc.
Conversely, a low fulfilment rate exposes logistical shortcomings such as picking/packing errors, forecasting inaccuracies, late deliveries, or stock-outs. This impacts brand perception, retained revenue, and customer confidence.
For online businesses, this metric can be a proxy for your performance to meet customer expectations.
Order Fulfillment Rate = (Total Orders Shipped / Total Orders Placed) x 100
Return Rate
Product return rate - How often are your customers returning back your products? Based on research, 25% of customers are returning 5% to 15% of products when shopping online.
If your online store has a high return rate, then this clearly indicates that changes in your quality products are needed.
For example, if in a month 20,000 products were sold by an online store and 5,000 products were returned. This return rate will be calculated as 5000 / 20000 x 100 = 25%.
Return Rate = Products Returned / Products Sold x 100
Ecommerce Success Score Calculator
Rather than monitor 10 different metrics separately, this calculator consolidates them into a single score out of 100. Simply plug your numbers into the monthly tab, and the sheet summarizes how you are performing as a business. Each month, you only need to grab these 10 metrics from your Shopify dashboard and input them into the sheet in column B. Using ideal ranges, each KPI is converted into a score out of 100.
These are then averaged together to create a single score out of
Ecommerce Success Score Calculator
Here is how you can read the average score:
Final Thoughts
There are many more ecommerce success metrics that you should learn, but these 10 are enough to get you started in the right direction. Ecommerce metrics are directly connected to your bottom line. They tell you what needs to be paid close attention to. If you are not tracking the metrics of your store, then you are blind. You will be able to make some well-educated guesses (more than likely), but the right data will help you to avoid making costly mistakes.
So, get the data right, and watch your sales grow!