A practical measurement guide for Shopify merchants and marketing managers. Covers the KPIs that actually matter across email, SMS, and push, how to wire Shopify and GA4 for omnichannel attribution, channel-level benchmarks, and a reporting framework you can operationalize in under a week.
The Measurement Problem Most Shopify Stores Have
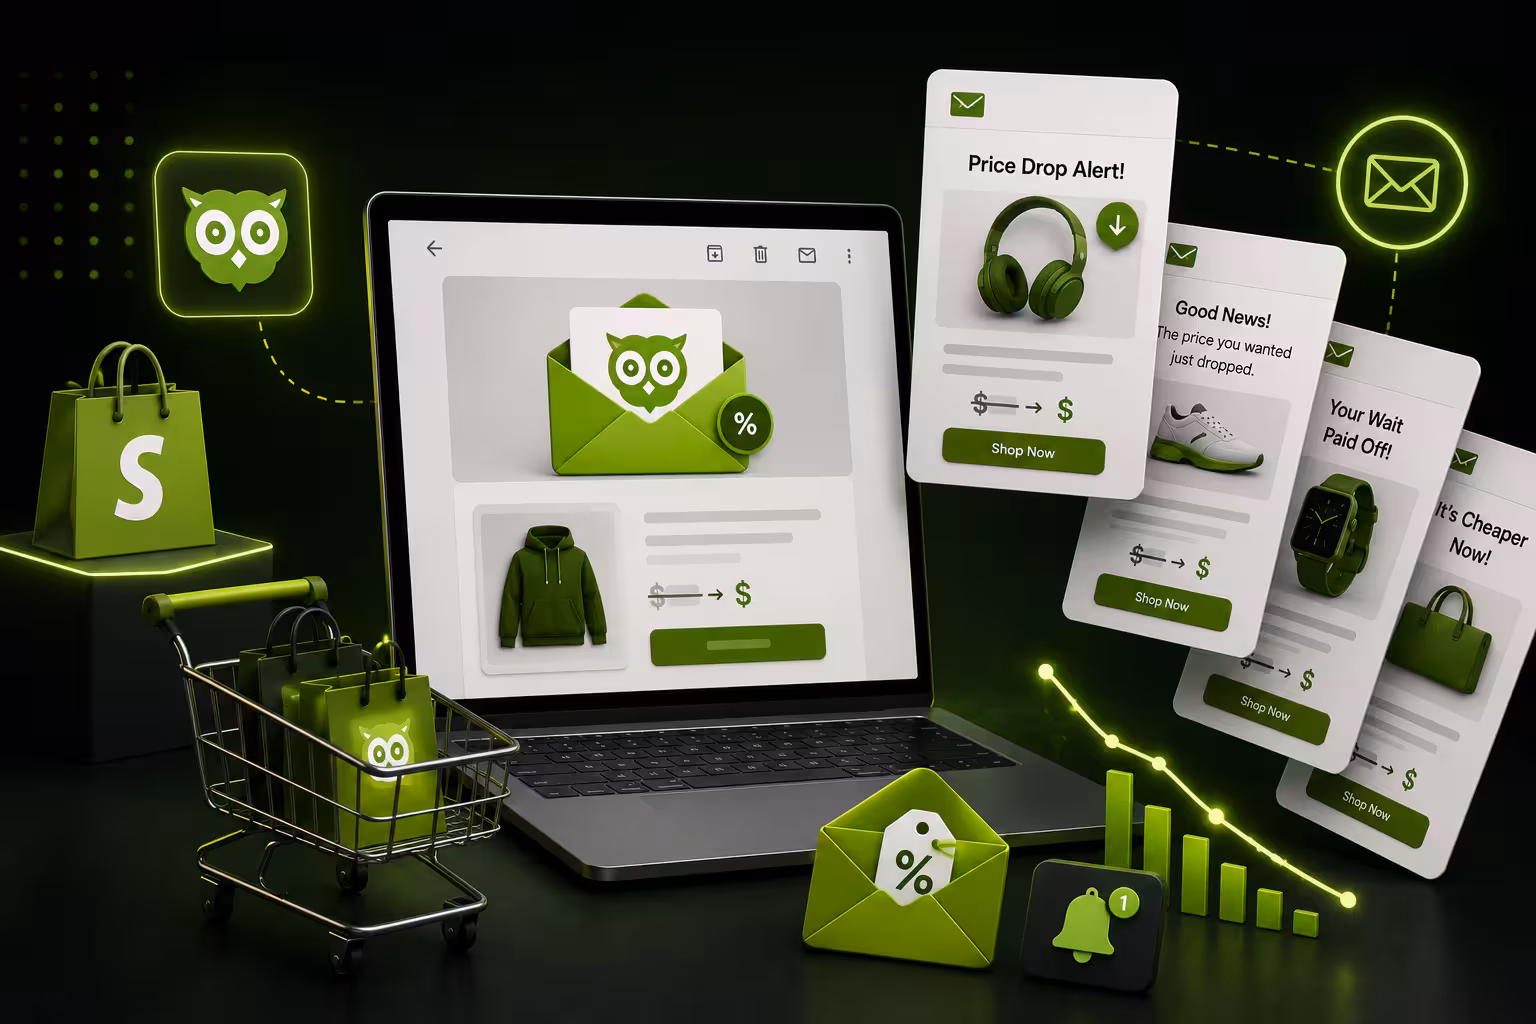
Running email, SMS, and push notifications from the same store is increasingly common. Knowing whether any of them are working together is still rare. Most merchants can pull an email open rate or a push click-through, but very few can answer a more important question: what is the incremental revenue from running all three channels versus just one or two?
That gap exists because omnichannel measurement is not just a reporting task. It requires a clear attribution model, consistent UTM hygiene, a properly configured GA4 property, and a methodology for separating channel lift from organic purchase behavior. This guide builds that framework from the ground up. If you are looking for the strategic context first, the Shopify omnichannel marketing strategy guide covers the channel architecture logic before diving into measurement.
Part 1: The KPIs That Actually Matter for Omnichannel
Why Vanity Metrics Mislead Omnichannel Decisions
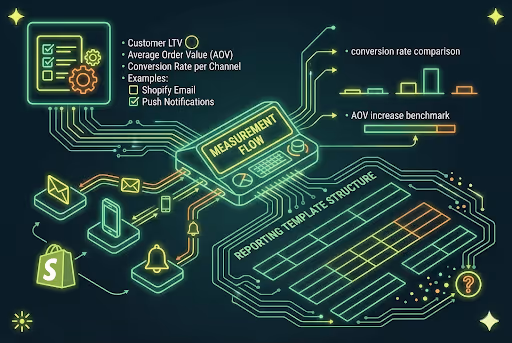
Email open rates, push impression counts, and SMS delivery percentages tell you whether your messages are reaching people. They do not tell you whether your channel mix is generating more revenue than a single-channel approach would. For omnichannel ROI measurement, the metrics that matter fall into three categories: channel-level performance, cross-channel lift, and customer-level value over time.
Segmentation is the prerequisite for all of this. You cannot measure cross-channel lift if your customer cohorts are not cleanly defined. The customer segmentation guide for Shopify and the lifecycle segmentation framework both give you the segment architecture you need before the measurement layer makes sense.
Tier 1: Channel-Level Performance Benchmarks
These are your baseline health metrics. Measure them per channel, per campaign type, and per segment. The table below shows the benchmarks to target for Shopify stores with a well-maintained list.
For email specifically, email open rate benchmarks for 2026 gives updated figures by industry vertical, which matters because a 30% open rate is strong for apparel but weak for B2B subscription stores. Use vertical-specific benchmarks, not platform averages.
Tier 2: Cross-Channel Lift Metrics
These metrics measure whether running multiple channels together produces results that exceed the sum of each channel run independently. They are harder to calculate but are the closest proxy for true omnichannel ROI.
Tier 3: Customer Lifetime Value and Retention Metrics
This is the top of the measurement hierarchy for omnichannel programs. Single-channel campaigns can move revenue in a campaign window. Multi-channel programs, when properly orchestrated, move LTV. The top ecommerce metrics to track for store health covers LTV, AOV, and retention rate frameworks in detail. For omnichannel specifically, focus on these three:
Part 2: Wiring Shopify and GA4 for Omnichannel Attribution
UTM Naming Convention: The Foundation of Clean Attribution
Everything in omnichannel reporting depends on consistent UTM parameters. If your email team uses utm_source=email, your SMS vendor auto-appends utm_source=sms_blast, and your push notifications use utm_source=pushowl, your GA4 reports will be fragmented and cross-channel paths will be impossible to reconstruct.
Standardize on this naming convention across all three channels before you configure anything else:
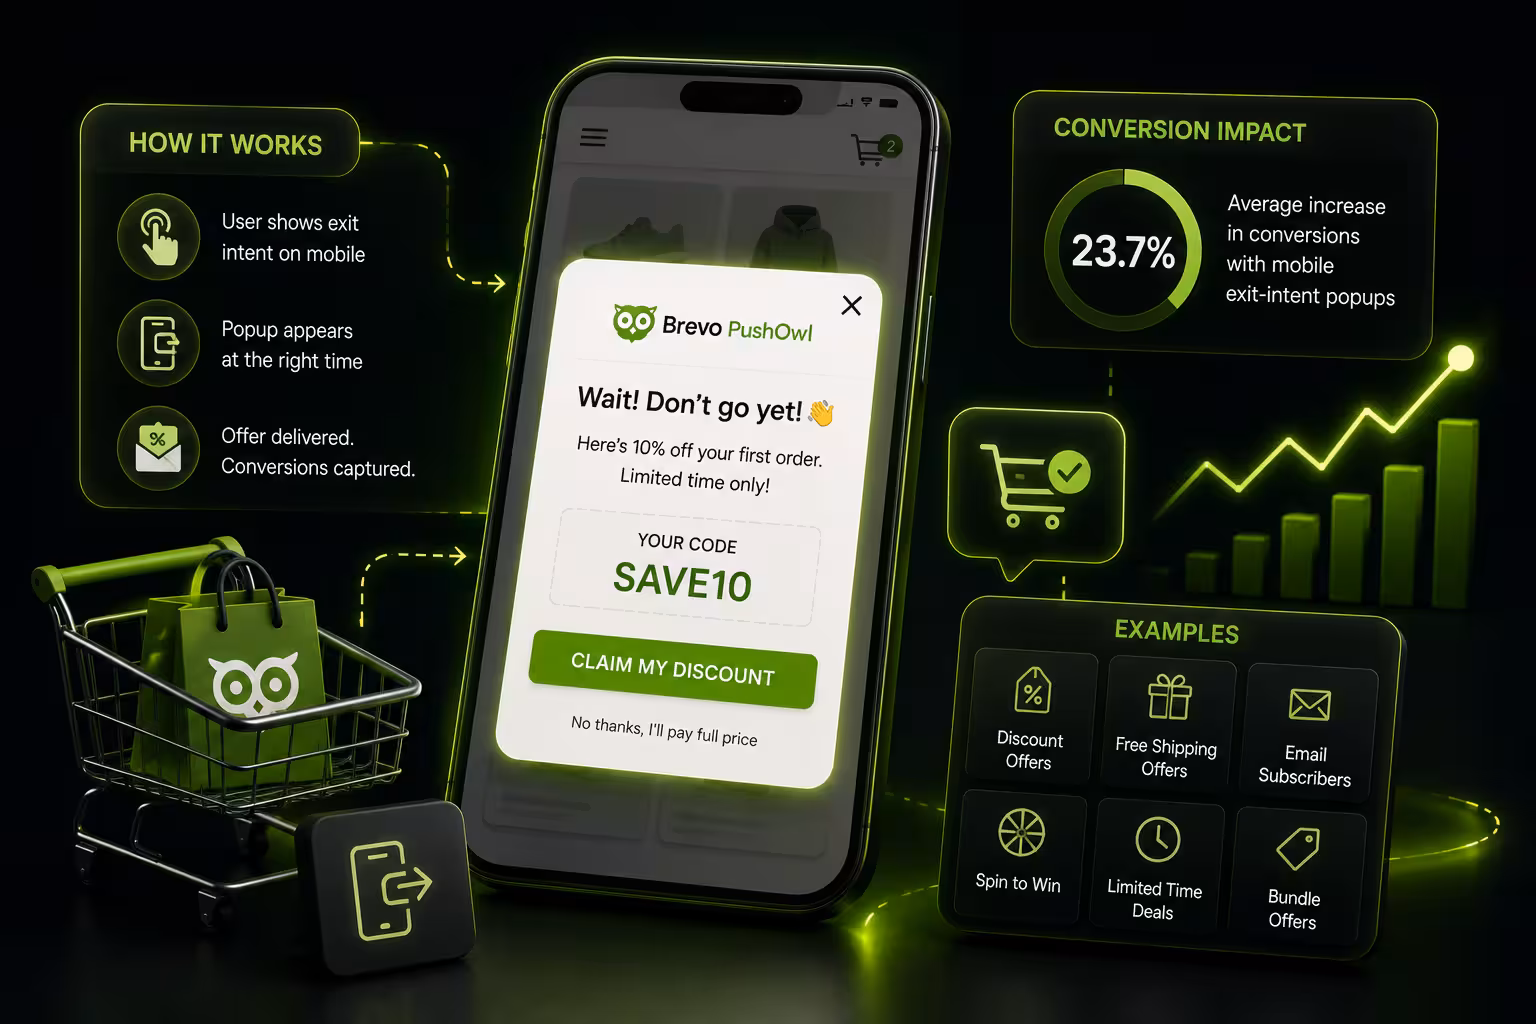
In PushOwl, UTM parameters are configurable at the campaign level and apply automatically to all links within a push notification or SMS. Set them once per campaign and they persist across all sends in that sequence.
GA4 Setup for Cross-Channel Path Analysis
Standard GA4 ecommerce tracking captures transactions and session source. For omnichannel path analysis you need two additional configurations.
Step 1: Enable Data-Driven Attribution
In GA4, go to Admin > Attribution Settings and switch the attribution model to Data-Driven. This distributes credit across all touchpoints in a conversion path rather than giving 100% of credit to the last click. For omnichannel campaigns where an email, an SMS, and a push notification may all contribute to one purchase, last-click attribution systematically undercounts every channel except the final one.
Step 2: Configure Channel Groupings
GA4 auto-groups sessions into Default Channel Groups. These defaults do not distinguish web push from organic or SMS from referral traffic. Create a custom channel group under Admin > Data Display > Channel Groups with rules that match your UTM naming convention:
Step 3: Build the Omnichannel Conversion Path Report
In GA4, navigate to Advertising > Attribution > Conversion Paths. Filter by your custom channel group. This report shows the sequence of channel touches that preceded each purchase. Look for:
For stores running Shopify's native analytics alongside GA4, the ecommerce company valuation metrics guide explains which Shopify dashboard metrics to use as sanity checks against your GA4 data, particularly for revenue attribution discrepancies.
Step 4: Shopify Flow Event Logging for Channel Attribution
For stores using Shopify Flow to trigger cross-channel sends, you can log channel-specific metafields at the customer level. Create a customer metafield (namespace: marketing, key: channel_first_touch) and update it via Flow when a customer first converts from each channel. This gives you a persistent, queryable record of channel attribution that lives in Shopify rather than GA4 and survives session expiry. The Shopify Flow and web push integration guide shows how to build Flow triggers that work with PushOwl events.
Part 3: The 30-Day Incrementality Test
Incrementality testing answers a different question than standard attribution. Attribution tells you which channel got credit for a conversion. Incrementality testing tells you whether the conversion would have happened anyway without that channel.
How to Run It
The setup is straightforward. For each channel you want to test, split your subscriber list into a holdout group (10 to 20% of subscribers who receive no sends from that channel for 30 days) and a treatment group (the remaining subscribers who receive the normal send cadence). At the end of the 30-day window, compare:
The revenue difference between the two groups is your incremental revenue attributed to that channel. Divide by your channel spend (platform cost plus labor) to get a clean ROI figure that is not inflated by organic purchase behavior.
This matters particularly for SMS, where click-through rates are high but it can be difficult to separate channel-driven purchases from customers who would have bought anyway. For stores running email marketing automation sequences alongside SMS, run the incrementality test on each channel independently rather than the combined program to identify which channel is carrying the most incremental lift.
Expected Incrementality Benchmarks by Channel
Part 4: The Omnichannel Reporting Dashboard Template
Most merchants either over-report (pulling every available metric into a spreadsheet that nobody reads) or under-report (checking top-line revenue and assuming everything is working). The reporting template below is designed for a weekly review cadence and a monthly strategy review.
Weekly Pulse Report (15-Minute Review)
Track these six metrics every week, per channel. Flag anything that moves more than 15% in either direction from the prior week.
Monthly Strategy Report (60-Minute Review)
The monthly review goes deeper into customer-level data. These are the questions to answer:
For the segment-level analysis, the market segmentation vs customer segmentation guide gives a useful framework for distinguishing behavioral segments (based on purchase history and channel engagement) from demographic segments (based on location, age, or acquisition source). Behavioral segments are almost always more actionable for omnichannel reporting.
The Channel Health Scorecard
Beyond the weekly and monthly reports, maintain a channel health scorecard that tracks trend direction over rolling 90-day windows. A channel can look healthy in a given week but show a slow decline in engagement that only becomes visible on a longer time horizon.
Email deliverability warrants its own monitoring track. Even a small decline in inbox placement can erase gains made by improving open rates or click-through rates. The email deliverability mistakes to avoid in 2026 covers the technical signals (bounce rate thresholds, spam complaint rates, authentication failures) that flag a deliverability problem before it affects revenue.
Part 5: Proving Channel ROI to a Skeptical Stakeholder
If you are a marketing manager building a case for expanding your channel stack, or a merchant trying to justify the cost of a multi-channel platform, the incrementality test and the LTV delta are your two strongest data points. Platform-reported attribution numbers will always look good because they assign revenue to whoever touched the customer last. Incremental revenue and LTV improvement are harder to game.
The Business Case Formula
Use this calculation for a clean, defensible ROI presentation:
Run this calculation separately for each channel, then run it again for the combined three-channel program vs. your best-performing single channel. The delta between single-channel and three-channel incremental revenue is the value of your omnichannel program.
For stores evaluating whether to consolidate channels onto a single platform versus managing separate point solutions, the email marketing platform comparison for Shopify is worth reviewing alongside the total cost model. Platform consolidation typically reduces attribution complexity and eliminates UTM conflicts that arise when multiple tools are tagging the same links differently.
It is also worth looking at ecommerce search metrics and Shopify store valuation metrics when building the broader business case. Investors and acquirers look at retention rate and channel diversification as signals of store health, not just top-line revenue. A store with strong omnichannel engagement and rising LTV is structurally more valuable than one relying on paid acquisition.
Where PushOwl Fits Into This Reporting Stack
PushOwl surfaces channel-level attribution data directly from the dashboard, including revenue attributed per campaign, per sequence, and per subscriber segment. For merchants running SMS, push, and email through PushOwl, all three channels report under a unified attribution model, which eliminates the UTM conflicts that arise when you are reconciling data from three separate vendors.
The platform also handles cross-channel suppression natively. When a customer converts on SMS, PushOwl can automatically suppress the corresponding push notification that was scheduled to fire 30 minutes later, preventing the redundant-send problem that inflates opt-out rates and dilutes your channel health metrics.
For merchants migrating from a multi-vendor setup, PushOwl's full-stack CaaS model includes migration support and a post-migration reporting audit to establish clean baselines before your first measurement cycle. The omnichannel marketing strategy guide for Shopify has the broader channel architecture context if you are still deciding how to structure your stack.
Start Measuring Before You Scale
The biggest measurement mistake Shopify merchants make is waiting until their omnichannel program is mature before setting up reporting. Attribution accuracy and incrementality baselines are much easier to establish at the start of a program than after 12 months of inconsistent UTM tagging and overlapping vendor attribution claims.
The framework in this guide is designed to be set up in one focused sprint. Wire the UTMs first. Configure GA4 channel groups. Run a 30-day incrementality test on your highest-volume channel. Then build the weekly pulse report. Once those four pieces are in place, adding channels and sequences does not add reporting complexity because the infrastructure already exists to measure them.
Measuring properly does not just tell you what is working. It gives you the data to double down on the channels and sequences that are producing real incremental revenue, and to cut the ones that look good on a dashboard but do not move customer lifetime value.