The SMS metrics that actually predict revenue for Shopify brands: click-through rate (CTR), conversion rate, revenue per recipient, net revenue per send, opt-out rate, deliverability rate, and subscriber lifetime value.
Other popular metrics like open rate, total messages sent, total subscriber count, and decontextualized industry benchmarks are vanity metrics that confuse more than they illuminate. In a channel where every single SMS costs real money, tracking the wrong numbers is not merely a reporting concern; it is a significant budget drain.
Open up your SMS platform right now. Count the metrics that appear. Chances are, you are seeing 8 to 12 of them. Some will display green up-arrows. One, likely to be open rate, will be near 98%.
The reality is that almost no SMS platform on Earth is equipped to reliably track opens.
The 98% open rate cited by every SMS vendor in their sales pitches originates from an industry estimate by the GSMA dating back to 2010. That figure represented delivery rates, the percentage of SMS messages that reached a mobile carrier's network, not the percentage actually read by a person. The SMS protocol itself does not incorporate tracking pixels, and read receipts are absent.
When an SMS platform reports your open rate, it is either mistakenly classifying a message's delivery as an open or deducing opens based on clicks, which forms a circular logical argument. Neither approach constitutes true measurement. Both are simply estimates masked as data.

This discrepancy is crucially important because SMS is unique among marketing channels in that every single message incurs a tangible cost. In the U.S., a single text message can cost anywhere from $0.01 to $0.05 depending on the volume of messages sent and the platform utilized. Email, in contrast, is nearly free to send in marginal quantities. A marketer celebrating a 98% open rate while simultaneously running SMS campaigns that yield only $0.02 per message revenue against a $0.03 sending cost is actually losing money, despite seeing a favorable green figure.
By the time you reach the end of this post, you will be well-versed in:
- The seven key metrics that accurately predict SMS revenue for Shopify brands.
- The four vanity metrics that you should stop tracking immediately.
- The correct way to calculate ROI, which most brands misunderstand.
- How to build a straightforward single-page dashboard that reflects genuine performance.
Why SMS Metrics Need a Different Playbook Than Email
Many Shopify brands initially grasp marketing analytics through the lens of email marketing. When they venture into SMS, they often import the same conceptual framework from email without considering whether it is a valid comparison. The truth is, it is not, and this fundamental mismatch lies at the heart of most SMS reporting issues.
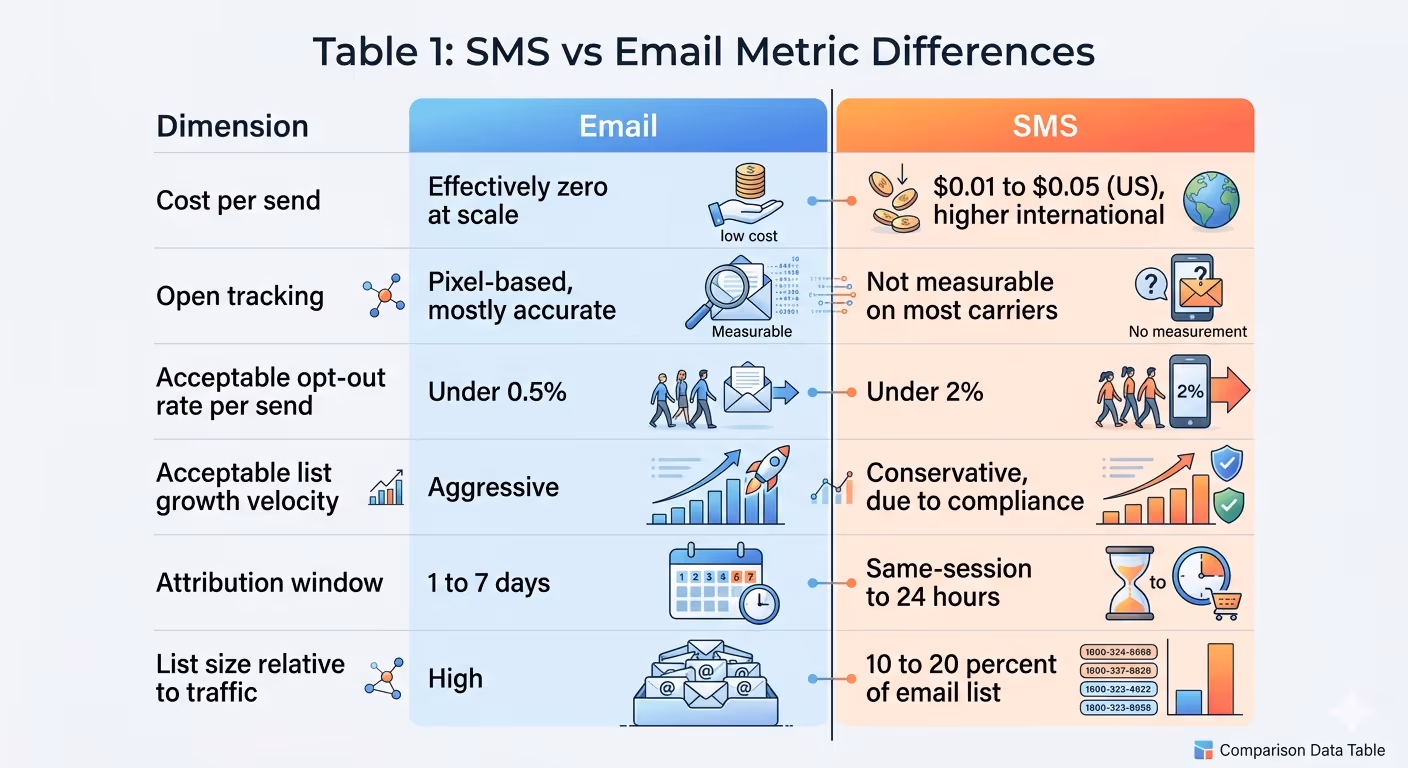
The first structural difference is cost. Sending an email to a list of 40,000 subscribers costs exactly the same, whether 2,000 open it or all 40,000 open it. At scale, the marginal cost of an email is virtually zero.
In stark contrast, sending an SMS to the same list will cost between $400 and $2,000. SMS costs are not a problem to be delegated to the billing department. They are a crucial campaign-level metric that belongs alongside CTR and conversion rate within the same integrated view.
1. Open Tracking Simply Does Not Exist in the SMS Realm
Email open tracking functions because an imperceptible tracking pixel is loaded when the recipient opens an email, thereby triggering a tracking event. SMS messages are plain text communications transmitted by cellular carriers. There is no tracking pixel and consequently, no event to log.
Platforms that report SMS open rates are relying on proxy indicators, labeling these estimations as opens. This is not a form of measurement; it is a guess punctuated by a percentage sign.
2. The Sensitivity Surrounding Unsubscribes Is Higher in SMS
A phone number is perceived as much more personal than an email address. Opt-out rates exceeding 2% per send in an SMS campaign should raise an immediate alarm. The equivalent benchmark for email is generally set at 0.5%.
Consequently, SMS lists are inherently more volatile, and their health metrics carry greater significance due to this fragility.
3. Carrier Filtering Can Lead to Invisible Drops in Delivery
U.S. cellular carriers like T-Mobile, Verizon, and AT&T carry out their own filtering mechanisms for promotional SMS messages.
Messages that contain certain triggering keywords or are sent by sources with poor reputations can be filtered out by the carriers before they even reach the recipient's handset, yet the SMS platform still registers them as delivered. Your dashboard might display a delivery rate of 97%, but the customer will never actually see the message.
4. Compliance Lapses Translate Directly Into Financial Repercussions
The U.S. Telephone Consumer Protection Act (TCPA) imposes statutory damages ranging from $500 to $1,500 for each unsolicited message sent to an individual without their explicit consent.
Moreover, issues related to A2P 10DLC registration impact both the per-message cost of sending and the deliverability rate concurrently. In SMS marketing, compliance metrics are not merely an administrative burden; they represent critical financial risk indicators.
The Four-Layer SMS Metrics Stack
Most brands track SMS metrics as a flat list open rate, CTR, conversions, revenue, but do not realize that each metric answers a different question at a different layer of performance. Here, we organise every important SMS metric into four layers. A great SMS programme will do well in all four. Most Shopify brands have strong numbers in one or two and have no idea what is going on in the other two.
- Layer 1: Engagement: Did the message get an action? Click-through rate is the key metric.
- Layer 2: Conversion: Did the engagement generate revenue? Conversion rate, AOV from SMS, and revenue per recipient live here.
- Layer 3: Financial: Is the channel profitable after costs? Net revenue per send, cost per message, and channel ROI are key here. Most brands totally miss this layer.
Layer 4: Health: Is the list sustainable? Opt-out rate, deliverability rate, complaint rate, and active subscriber percentage live here. These are the best leading indicators, so you can tell that performance is degrading before your engagement numbers suffer.
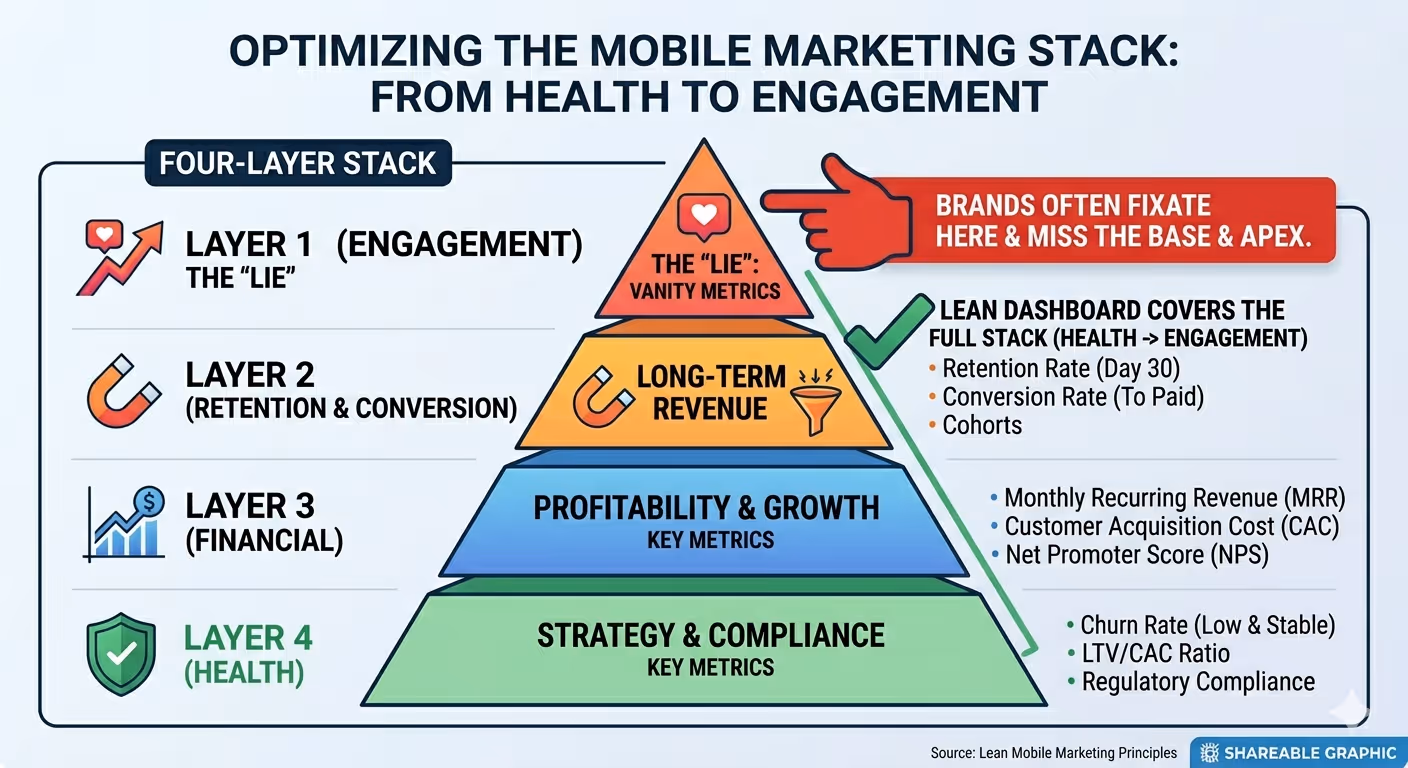
The biggest trap in SMS analytics is spending 80% of your reporting time looking at Layer 1 and zero attention on Layers 3 and 4. You can run campaigns with a high CTR, but that lose money because no one bothered calculating the send cost vs RPR. A brand might see solid conversion rates, but has no idea that its 30-day opt-out trend is on a runaway path towards deliverability hell.
If your SMS dashboard shows at least one metric from each of these four layers, you are missing visibility in at least one dimension of your SMS programme.
The 7 SMS Metrics That Are Worth Tracking
SMS campaigns offer instant visibility, but most Shopify brands track the wrong data. Open rates and click rates by themselves will not tell you whether your SMS channel is profitable, sustainable over the long haul, or helping to retain customers.
The real signal comes from revenue efficiency, the quality of engagement, the behavior surrounding unsubscribes, and how timing plays into conversions. Tracking these will allow you to understand which campaigns are driving true purchases, which SMS flows are making customers tired of receiving texts, and where your messaging strategy might be lacking. Here are the 7 SMS metrics you ought to track if you aim to boost SMS revenue without damaging customer trust or blowing money on text messages.
1. Click-Through Rate
Definition: Number of unique clicks / Number of messages delivered.
Why it matters: CTR is the best engagement metric available on the SMS channel because SMS does not offer any open-rate tracking. A link click is binary, trackable, and has a clear connection to user intent.
Benchmark range: 8-20% for promotional sends. 25-45% for triggered flows (abandoned cart, back-in-stock notifications, replenishment reminders). (Always check the most current Postscript and Attentive benchmarks before posting.)
How to read it: A CTR below 8% on promotional campaigns generally points to problems with your copy or audience segment, not issues with deliverability. If your messages are not being delivered, you will see it in your deliverability rate. Poor CTR indicates a relevance problem: you might have the wrong offer, you are targeting the wrong audience, or your message just is not compelling or urgent enough.
2. Conversion Rate
Definition: Orders attributed to SMS / Number of clicks within the attribution window.
Why it matters: A click is not revenue. This is where engagement either turns into sales or exposes the divide between the marketing message and the actual customer buying experience.
Benchmark range: 5-15% for promotional campaigns. 15-30% for triggered flows. (Always check the current Klaviyo and Postscript SMS benchmark reports.)
How to read it: If you are getting a high CTR but a poor conversion rate, the issue lies with your landing page. The SMS did its job, but the page the message directs people to did not. Conversely, if you have a low CTR but high conversion, the problem lies with your audience reach: the offer might be excellent, but your message simply is not being sent to or engaging the right people. Before applying a solution, diagnose which of these patterns applies to you.
3. Revenue Per Recipient
Definition: Total revenue from an SMS campaign / Number of messages delivered.
Why it matters: RPR is the number one top-line SMS metric because it standardises for the size of your list and combines both CTR and conversion rates into one indicator. If one brand is sending to 6,000 subscribers while another is sending to 60,000, their total revenue figures are meaningless comparisons.
However, both brands can compare their respective RPRs. Most crucially, RPR makes profitability transparent in an instant: if your RPR is $0.18 and you are paying $0.03 per message, the send was profitable. If your RPR is $0.02 and you are paying $0.03 per message, that send lost you money.
Benchmark range: $0.50-$3.00 per recipient for promotional SMS messages. Typically, triggered SMS flows can achieve an RPR of more than $2.00. (Verify with current data from Postscript or Attentive before publishing.)
How to read it: RPR also acts as the clearest measure for comparison across different marketing channels, as both SMS and email RPR can be calculated in the same way. This makes it possible to allocate marketing budgets rationally based on actual per-recipient costs.
4. Cost Per Message and Net Revenue Per Send
Definition: SMS spending / Number of messages sent. Net revenue per send is the revenue from a campaign minus the entire cost associated with sending the messages.
Why it matters: SMS is the only marketing channel where a cost is directly linked to every single send. The majority of SMS platforms will hide this expense within their billing reports. Making this cost explicit in campaign reporting prevents celebrating campaigns that failed to generate revenue.
Benchmark range: SMS in the United States averages between $0.01 and $0.04 per standard message. MMS typically costs around twice that. Rates can fluctuate widely for international sends.
The following table demonstrates precisely why this calculation is mandatory:

Send B looks good in a vacuum because the total revenue exceeds the total costs: $1,310 > $1,300. With cost factored in, though, B resulted in a mere $10 net profit. We should never again re-run B, especially given we should avoid anything else like this, given this metric shows B only paid $1.03 for every $1 of profit. That is terrible.
5. Opt-Out Rate
Definition: The number of unique users who opt out, divided by the number of messages successfully delivered by the SMS provider, for a given send.
Why it matters: Opt-out rates serve as a sensitive early warning system. A noticeable rise in opt-outs can signal impending problems with deliverability and a higher complaint rate to the carriers, sometimes weeks in advance. By the time issues appear in other KPIs like CTR or conversion rate, the trend of growing opt-outs will have been on the rise for some time.
Benchmark range: Rates below 1% per send are generally considered healthy. Between 1% and 2% per send should signal a warning, and any rate above 2% necessitates an investigation into the campaign before the next one is scheduled to go out. Issues here typically stem from one of four common causes: sending the offer to the wrong customer segment, sending messages too frequently, the offer itself not aligning with the intended audience, or using a message tone that feels intrusive or annoying to the recipients.
How to read it: It is important to focus on the rolling 30-day average rather than the opt-out rate of any individual SMS send. One campaign that occurs with a 2.5% opt-out rate should be viewed as mere noise; however, five consecutive sends with a consistent average of 1.9% opt-out is a structural signal and warrants attention.
6. Deliverability Rate
Definition: The number of messages successfully delivered by the SMS provider divided by the total number of messages sent.
Why it matters: Most brands take a delivery rate of 96% as a clear indicator that 96% of their audience received the intended message. In reality, some messages marked as "delivered" actually reach the carrier's network and are then filtered out before they reach the subscriber's handset. The SMS platform has no way of detecting or flagging this filtering process and correctly labels the message as "delivered." Therefore, the actual number of messages viewed on a screen is generally lower than the reported delivery rate.
Benchmark range: Rates of 95% or higher in the United States are acceptable for compliant, registered senders. Outside the U.S., delivery rates vary from 70% to 99%, depending on the specific country and carrier involved.
How to read it: Do not rely on the aggregate deliverability rate. Whenever possible, segment this metric by country and by carrier where the platform allows. A seemingly healthy aggregate delivery rate of 95% can be misleading if the rate for T-Mobile specifically is only 74%. This indicates a reputation problem with that particular carrier, which will require a distinct solution. The aggregate number conveniently masks this underlying issue.
7. Subscriber Lifetime Value (LTV)
Definition: The total revenue generated from a customer specifically through SMS marketing touchpoints across the entire span of their relationship with the brand.
Why it matters: All other SMS metrics gauge the effectiveness of a campaign over a specific time window or the performance of an individual send. SMS LTV, on the other hand, evaluates the long-term economic viability of a subscriber relationship. Crucially, it is the only metric that truly answers whether acquiring a particular subscriber is cost-effective and how much should be spent on SMS opt-in incentives.
Benchmark range: For Shopify merchants with an average order value (AOV) between $50 and $150, the typical 12-month SMS LTV falls in the range of $40 to $200. Brands operating in high-frequency replenishment categories usually find their SMS LTV toward the higher end of this range. (This is an estimated benchmark based on general e-commerce category patterns. Replace with actual PushOwl merchant data if it becomes available.)
How to read it: Always compare SMS LTV against the SMS acquisition cost. If the SMS LTV is less than three times the acquisition cost, it generally indicates that either the opt-in incentive being offered is too generous and costly or the post-signup engagement strategy is not robust enough to convert subscribers into repeat buyers effectively.
The 4 SMS Metrics to Stop Reporting
Many Shopify brands obsess over metrics that sound great on spreadsheets but offer virtually no useful insights about their revenue, profitability, or subscribers. These are often fake metrics that mask the actual business problems behind their SMS program so that founders keep believing they are making money when they are not.
1. Open Rate
There is a long-standing myth that SMS boasts a 98% open rate. In reality, this figure originates from a GSMA estimate of carrier delivery confirmation rates from around 2010, and it has absolutely nothing to do with actual message opens. The SMS protocol never could incorporate tracking pixels or send read receipts on a widespread scale.
Platforms that claim to provide SMS open rates are either measuring message delivery rates or deriving opens through inferred click data, neither of which is a true open rate. The damage caused by promoting this metric extends beyond a flawed analytical understanding.
When marketing departments present a 98% open rate to a CEO or a board, they encourage unrealistic performance expectations that no campaign can realistically maintain over time. The first instance where campaign results fall short will unfortunately lead to a significant loss of credibility for the marketing team.

The 98% Open Rate: What It Actually Measures
This 98% figure has appeared in SMS marketing collateral for more than ten years. The initial source of this number was a GSMA estimate of carrier delivery confirmation rates, not a study designed to find out if people were reading the messages.
The SMS protocol itself lacks the functionality for tracking message opens. Any platform reporting an SMS open rate is essentially tracking something entirely different than opens. To accurately benchmark customer engagement, stick to measuring the click-through rate; it is a quantifiable metric that is clean and directly linked to a customer's action.
What to track instead:
Click-through rate. A strong promotional CTR of between 8% and 20% provides a much clearer insight into the performance of your SMS program than the meaningless 98% open rate figure that nobody can actually measure.
2. Total Messages Sent
While in email, total messages sent serves as a reasonable operational metric, in SMS, it is primarily a cost-related metric. Reporting that your organization sent 600,000 SMS messages in a quarter is essentially reporting the amount spent on the channel, rather than what was earned from it.
Volume is an input, not an output metric. Brands that mistakenly prioritize maximizing their send volume often resort to sending too many messages to their subscribers, thereby driving up opt-out rates, depleting customer trust, and spreading their SMS budget too thin across numerous low-return messages instead of focusing it on high-intent moments where RPR (Revenue Per Record) is at its highest.
What to track instead:
Net revenue per send and RPR. Use the volume of messages sent as the denominator when calculating these metrics, than presenting it as a prominent headline number.
3. Total Subscriber Count
Having a large SMS list might appear impressive on a dashboard, but it is also one of the most deceiving metrics in the SMS channel. SMS lists decay much more rapidly than email lists. This is because phone numbers tend to change more frequently than email addresses; carriers can filter messages sent to inactive phone numbers, and subscribers who passively disengage, meaning they stop reading messages without actively opting out, go undetected in any of the standard SMS metrics.
These silent disengagers negatively impact your CTR and conversion rates while simultaneously costing money with every message that is sent to them. Consider a brand with 50,000 subscribers and a 30% engagement rate; this means they have an active audience of only 15,000.
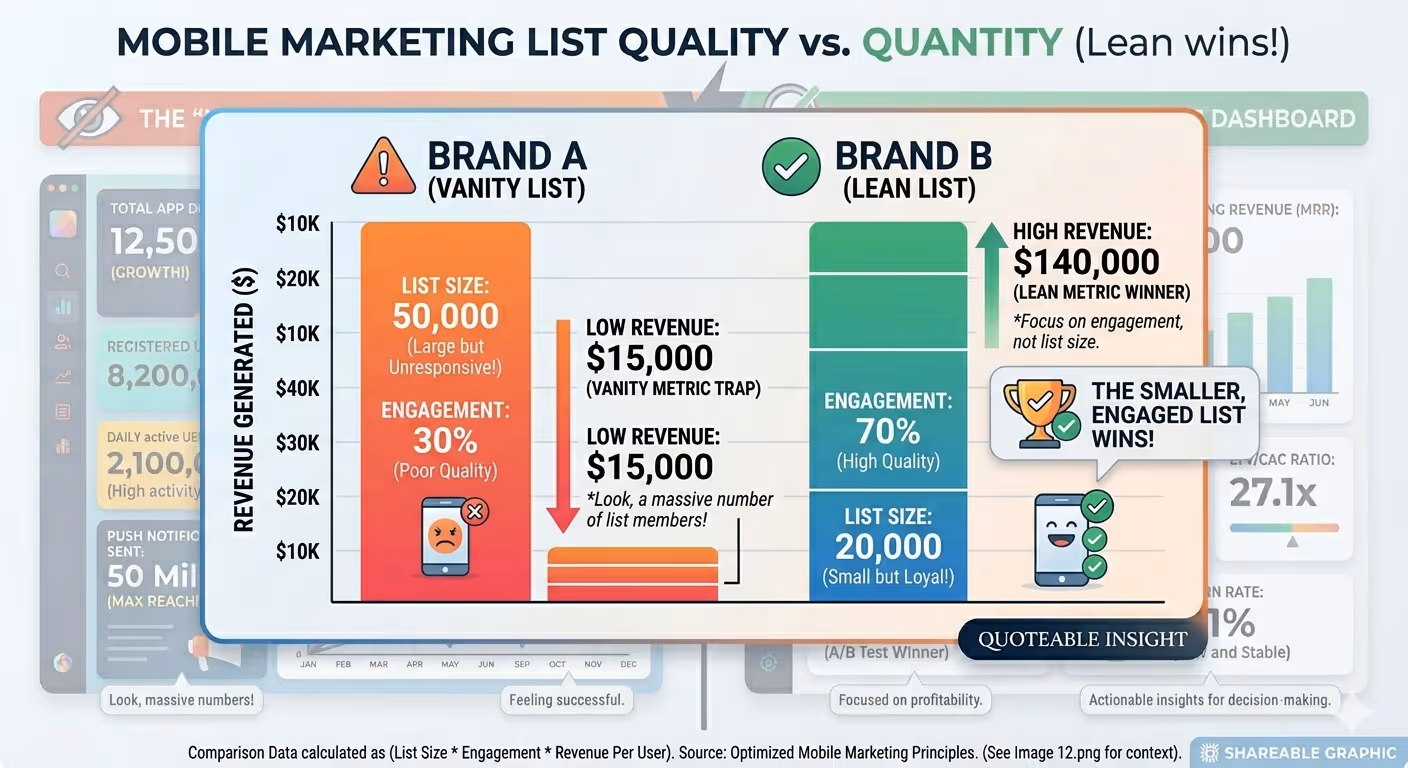
Now, imagine a brand with 20,000 subscribers and a 70% engagement rate; they have an active audience of 14,000. Their true reachable audience size is almost identical, yet the first brand spends money on 50,000 message sends for each campaign, while the second brand only spends money on 20,000 sends.
What to track instead:
Engaged subscribers in the last 90 days. This figure accurately represents your addressable audience for any given SMS campaign.
4. Industry Benchmarks Without Context
SMS benchmark data published by companies like Postscript, Attentive, and Klaviyo is calculated by averaging the performance of thousands of diverse brands operating across various industries. These brands may differ in terms of price points, list sizes, and sending frequencies.
A 12% CTR, for example, would be considered excellent for a furniture brand with an average order value of $600, but it would be considered a disappointing result for a brand that sells impulse items with an average order value of $22. While the CTR metric itself remains the same, the surrounding context dictates opposite interpretations of campaign performance.
What to track instead:
Internal benchmarks segmented by message type, audience segment, and time of send. Your own historical performance data is the only true benchmark that reflects your unique customer base.
External benchmarks serve one legitimate purpose: to assist in persuading a finance team to approve your SMS budget during the planning stage of a fiscal year; however, they offer no practical value when making real-time campaign decisions.
The Cost-Aware SMS Dashboard
The primary objective of any SMS dashboard is to provide clear answers to three fundamental questions simultaneously: Is the channel effectively engaging with the target audience? Is that engagement translating into actual revenue? Is the revenue generated profitable after accounting for all costs?

Regrettably, most SMS platforms primarily address the first question, partially answer the second, and completely overlook the third. Below is a recommended eight-metric dashboard that comprehensively covers all three of these crucial questions:
Create two dashboards in the campaign view for the per-send report and in the channel view for the 30-day view. Colour code all the health metric values if one threshold is not met and can be flagged immediately without having to do a manual calculation. Everything except these eight metrics is diagnostic metrics, not reporting metrics useful for understanding why an alert fired.
How Brands Mess Up SMS ROI: The Correct Calculation
There are three versions of this formula. Most people use the first and most incorrect one below.
Incorrect: (Revenue ÷ SMS spend)
Closer: ((Revenue − SMS spend) ÷ SMS spend)
Correct: ((Revenue − SMS spend − COGS − Discount Value Applied) ÷ SMS spend)
The discount correction is often missed and inflates ROI the most. A 25% off campaign sent via SMS should not generate ROI calculated against gross revenue; a 25% discount has been applied to sales, therefore reducing the total revenue value generated on sales from that send.
Comparing this calculated ROI number against other channels that do not factor in such discounts is disingenuous and cannot lead to informed budget decisions.

It is exacerbated by the attribution window. A 7-day click window counts any purchase made within a week after somebody clicks a link, not just the purchase prompted by the SMS, but also subsequent purchases spurred by an e-mail blast, a retargeting-ad campaign, or merely an organic visit.
A 1-day click window only attributes purchases prompted by an SMS link directly. If the attribution is not customisable, take its numbers only directionally.
Compliance Metrics That Quietly Become Financial Metrics

There is not much detail about how compliance starts to break down in most SMS guides, a glaring omission. SMS marketing compliance does not first manifest as a compliance issue; it first shows up as deliverability, reputation, or finally, lost revenue.
1. Complaint rate
Every spam report your business receives in response to a non-compliant text-message marketing campaign is counted at the network level of each mobile network provider. If your complaint rate is not the lowest of the lowest, mobile carriers will start filtering your good, non-spammy sends as well until your complaint rate is reset.
2. A2P 10DLC registration
This is the system currently being instituted in the US for all commercial messaging systems. Brand registration means sharing your company name with the mobile carriers. If you send SMS messages commercially but have not registered your brand and use-case with carriers, expect to be subject to additional per-message surcharges and higher message filtering rates. (Please confirm the enforcement status before you publish.)
3. List acquisition compliance
The percent of customers on your SMS mailing list that subscribed with an opt-in method compliant with TCPA, versus customers who were imported from or transferred over from another list. Statutory damages under TCPA begin at $500 per message sent, going up to $1,500 per message sent if there are higher damages or repeated violations.
Not having a TCPA compliant SMS mailing list means that you are not really marketing to an asset with a warning sign; you have acquired a financial liability that increases with every text message that you broadcast.
4. Carrier trigger words
Words in ALL CAPS such as WIN, FREE, or CASH, as well as certain promotional wording patterns, will be filtered by carriers no matter if your sender reputation is good. Test any templates for these before running any sort of campaign type.
How PushOwl Helps Shopify Brands Track What Actually Matters
The problem most Shopify businesses have when trying to understand SMS metrics is a platform problem. SMS campaigns run in an SMS app, e-mails run in a different app, and web push campaigns run in a third one.
Because each platform calculates its own biased metrics, your Shopify store brand might show ROI of 2X across SMS, e-mail, and web push. But in this situation, the sale made to one customer who received an SMS, followed up by an e-mail, then received a push notification and purchased, will be reported by each app as an individual conversion. Revenue will be multiplied.
All three apps look good about ROI, which does not do anything but create noise around your marketing results.
PushOwl brings SMS, email and web push together on one Shopify-native platform with 1-touch attribution so your RPR, net revenue per send and channel ROI all follow the same, unique logic, window and customer record. Sales will be attributed once to one touchpoint and viewed in one dashboard, whether it was caused by SMS, email or web push.
In addition to these powerful capabilities, you will see that PushOwl's campaign view displays CTR, conversion rate, RPR and net revenue per send with the SMS costs integrated into the financial metrics, not buried into a separate billing report. PushOwl's health view uses a rolling 30-day average for opt-out rate, so you spot trends before they erupt into crises.
Deliverability rates will be broken out country by country instead of a flat total, giving you the actual diagnostic tips you need to pinpoint where problems lie.
Because PushOwl combines all three channels SMS, email, and web push within its native platform, you can get your hands on comparable insights between the LTV of SMS, email, and push. Armed with these metrics, you will be able to confidently allocate your ad budget most cost-effectively based on actual per-subscriber economics rather than your individual channel's statistics.
The Bottom Line
SMS is the only marketing channel in the industry with a financial cost for every single send. That sole point fundamentally ought to dictate the definition, analysis, and output of all statistics on the channel, a change that has yet to occur in the SMS world for many Shopify brands engaged in it.
The companies at the vanguard of profitable SMS marketing possess intimate knowledge of their revenue per sending (RPR). These successful entities closely watch the opt-out trends of the past 30 days to intercept issues before they become list health crises. Furthermore, they employ a precise formula to calculate ROI, which includes subtracting any discount codes used.
These leaders also develop benchmarks using their own proprietary data rather than striving for an average that reflects someone else's audience, which cannot possibly apply to their business.
Drop open rate. Start tracking all eight core metrics on a single dashboard. Always use the accurate ROI calculation formula. As closely as you monitor engagement metrics, meticulously track the health metrics on the platform, especially in the SMS marketing arena, where the health metrics offer vital indicators that can preemptively reveal whether all other channels remain effective three months from the present.
While SMS metrics might not seem inherently complex, they provide the necessary honest data for businesses to make the most appropriate decisions. SMS, by virtue of the direct correlation between dashboard data and billing statements within the same reporting period, is a channel that yields a much higher return on truthful metrics than any alternative.